Kubernetes
- The Kubernetes Handbook
- Как разворачивать MongoDB в Kubernetes
- Стратегии развертывания в Kubernetes
- Создание доступа в кубернетес при наличии token и api endpoint
- Настройка безотказного K8s
- Стратегии развертывания в Kubernetes
- Cluster Autoscaler: как он работает и решение частых проблем
- K8s: Deployments против StatefulSets против DaemonSets
- Postgres connection pool для Kubernetes
- Kubernetes Rolling Update Configuration
- Basics of autoscaling nodes and pods in Kubernetes
- Architecting Kubernetes clusters — choosing a worker node size
- 2 способа направить трафик Ingress между пространствами Kubernetes
- Сетевое взаимодействие между подами
The Kubernetes Handbook
Introduction to Container Orchestration and Kubernetes
According to Red Hat —
"Container orchestration is the process of automating the deployment, management, scaling, and networking tasks of containers.
It can be used in any environment where you use containers and can help you deploy the same application across different environments without requiring any redesigning".
Let me show you an example. Assume that you have developed an amazing application that suggests to people what they should eat depending on the time of day.
Now assume that you've containerized the application using Docker and deployed it on AWS.
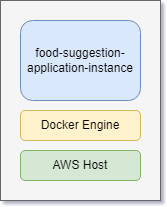
If the application goes down for any reason, the users lose access to your service immediately.
To solve this issue, you can make multiple copies or replicas of the same application and make it highly available.
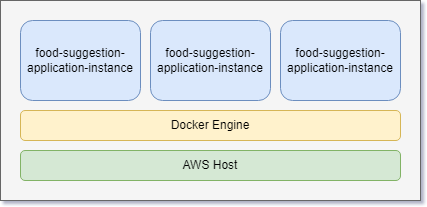
Even if one of the instances goes down, the other two will be available to the users.
Now assume that your application has become wildly popular among the night owls and your servers are being flooded with requests at night, while you're sleeping.
What if all the instances go down due to overload? Who's going to do the scaling? Even if you scale up and make 50 replicas of your application, who's going to check on their health? How are going to set-up the networking so that requests hit the right endpoint? Load balancing is going to be a big concern as well, isn't it?
Kubernetes can make things much easier for these kinds of situations. It's a container orchestration platform that consists of several components and it works tirelessly to keep your servers in the state that you desire.
Assume that you want to have 50 replicas of your application running continuously. Even if there is a sudden rise in the user count, the server needs to be scaled up automatically.
You just tell your needs to Kubernetes and it will do the rest of the heavy lifting for you.
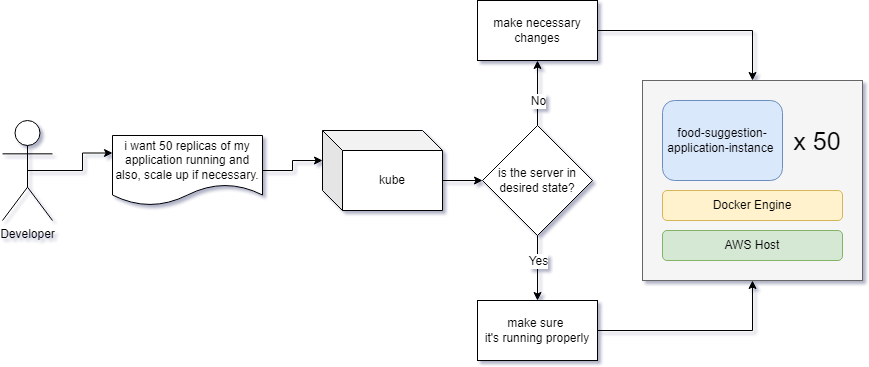 Kubernetes will not only implement the state, it'll also maintain it. It will make additional replicas if any of the old ones dies, manage the networking and storage, rollout or rollback updates, or even upscale the server if ever necessary.
Installing Kubernetes
Running Kubernetes in your local machine is actually a lot different than running Kubernetes on the cloud. To get Kubernetes up and running, you need two programs.
-
minikube - it runs a single-node Kubernetes cluster inside a Virtual Machine (VM) on your local computer.
-
kubectl - The Kubernetes command-line tool, which allows you to run commands against Kubernetes clusters. Apart from these two programs, you'll also need a hypervisor and a containerization platform. Docker is the obvious choice for the containerization platform. Recommended hypervisors are as follows:
-
Hyper-V for Windows
-
HyperKit for Mac
-
Docker for Linux Hyper-V comes built into Windows 10 (Pro, Enterprise, and Education) as an optional feature and can be turned on from the control panel.
HyperKit comes bundled with Docker Desktop for Mac as a core component.
And on Linux, you can bypass the entire hypervisor layer by using Docker directly. It's much faster than using any hypervisor and is the recommended way to run Kubernetes on Linux.
You may go ahead and install any of the above mentioned hypervisors. Or if you want to keep things simple, just get VirtualBox.
For the rest of the article, I'll assume that you're using VirtualBox. Don't worry though, even if you're using something else, there shouldn't be that much of a difference.
I'll be using minikube with the Docker driver on a Ubuntu machine throughout the entire article. Once you have installed the hypervisor and the containerization platform, it's time to install the minikube and kubectl programs.
kubectl usually comes bundled with Docker Desktop on Mac and Windows. Installation instructions for Linux can be found here.
minikube, on the other hand, has to be installed on all three of the systems. You can use Homebrew on Mac, and Chocolatey on Windows to install minikube. Installation instructions for Linux can be found here.
Once you've installed them, you can test out both programs by executing the following commands:
minikube version

# minikube version: v1.12.1
# commit: 5664228288552de9f3a446ea4f51c6f29bbdd0e0

kubectl version

# Client Version: version.Info{Major:"1", Minor:"18", GitVersion:"v1.18.6", GitCommit:"dff82dc0de47299ab66c83c626e08b245ab19037", GitTreeState:"clean", BuildDate:"2020-07-16T00:04:31Z", GoVersion:"go1.14.4", Compiler:"gc", Platform:"darwin/amd64"}
# Server Version: version.Info{Major:"1", Minor:"18", GitVersion:"v1.18.3", GitCommit:"2e7996e3e2712684bc73f0dec0200d64eec7fe40", GitTreeState:"clean", BuildDate:"2020-05-20T12:43:34Z", GoVersion:"go1.13.9", Compiler:"gc", Platform:"linux/amd64"}
If you've downloaded the right versions for your operating system and have set up the paths properly, you should be ready to go.
As I've already mentioned, minikube runs a single-node Kubernetes cluster inside a Virtual Machine (VM) on your local computer. I'll explain clusters and nodes in greater details in an upcoming section.
For now, understand that minikube creates a regular VM using your hypervisor of choice and treats that as a Kubernetes cluster.
If you face any problems in this section please have a look at the Troubleshooting section at the end of this article.
Before you start minikube, you have to set the correct hypervisor driver for it to use. To set VirtualBox as the default driver, execute the following command:
minikube config set driver virtualbox

# ❗ These changes will take effect upon a minikube delete and then a minikube start
You can replace virtualbox with hyperv, hyperkit, or docker as per your preference. This command is necessary for the first time only.
To start minikube, execute the following command:
minikube start

# 😄 minikube v1.12.1 on Ubuntu 20.04
# ✨ Using the virtualbox driver based on existing profile
# 👍 Starting control plane node minikube in cluster minikube
# 🏃 Updating the running virtualbox "minikube" VM ...
# 🐳 Preparing Kubernetes v1.18.3 on Docker 19.03.12 ...
# 🔎 Verifying Kubernetes components...
# 🌟 Enabled addons: default-storageclass, storage-provisioner
# 🏄 Done! kubectl is now configured to use "minikube"
You can stop minikube by executing the minikube stop command.
Hello World in Kubernetes
Now that you have Kubernetes on your local system, it's time to get your hands dirty. In this example you'll be deploying a very simple application to your local cluster and getting familiar with the fundamentals.
There will be terminologies like pod, service, load balancer, and so on in this section. Don't stress if you don't understand them right away. I'll go into great details explaining each of them in The Full Picture sub-section.
If you've started minikube in the previous section then you're ready to go. Otherwise you'll have to start it now. Once minikube has started, execute the following command in your terminal:
kubectl run hello-kube --image=fhsinchy/hello-kube --port=80

# pod/hello-kube created
You'll see the pod/hello-kube created message almost immediately. The run command runs the given container image inside a pod.
Pods are like a box that encapsulates a container. To make sure the pod has been created and is running, execute the following command:
kubectl get pod

# NAME         READY   STATUS    RESTARTS   AGE
# hello-kube   1/1     Running   0          3m3s
You should see Running in the STATUS column. If you see something like ContainerCreating, wait for a minute or two and check again.
Pods by default are inaccessible from outside the cluster. To make them accessible, you have to expose them using a service. So, once the pod is up and running, execute the following command to expose the pod:
kubectl expose pod hello-kube --type=LoadBalancer --port=80

# service/hello-kube exposed
To make sure the load balancer service has been created successfully, execute the following command:
kubectl get service

# NAME         TYPE           CLUSTER-IP     EXTERNAL-IP   PORT(S)        AGE
# hello-kube   LoadBalancer   10.109.60.75   <pending>     80:30848/TCP   119s
# kubernetes   ClusterIP      10.96.0.1      <none>        443/TCP        7h47m
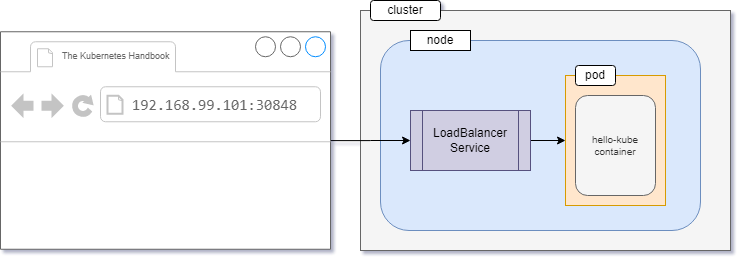
Make sure you see the hello-kube service in the list. Now that you have a pod running that is exposed, you can go ahead and access that. Execute the following command to do so:
minikube service hello-kube

# |-----------|------------|-------------|-----------------------------|
# | NAMESPACE |    NAME    | TARGET PORT |             URL             |
# |-----------|------------|-------------|-----------------------------|
# | default   | hello-kube |          80 | http://192.168.99.101:30848 |
# |-----------|------------|-------------|-----------------------------|
# 🎉 Opening service default/hello-kube in default browser...
Your default web browser should open automatically and you should see something like this:
 This is a very simple JavaScript application that I've put together using vite and a little bit of CSS. To understand what you just did, you have to gain a good understanding of the Kubernetes architecture.
Kubernetes Architecture
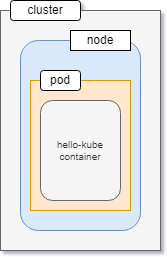
In the world of Kubernetes, a node can be either a physical or a virtual machine with a given role. A collection of such machines or servers using a shared network to communicate between each other is called a cluster.
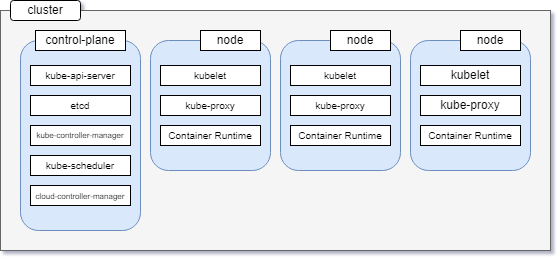 In your local setup, minikube is a single node Kubernetes cluster. So instead of having multiple servers like in the diagram above, minikube has only one that acts as both the main server and the node.
 Each server in a Kubernetes cluster gets a role. There are two possible roles:
- control-plane — Makes most of the necessary decisions and acts as sort of the brains of the entire cluster. This can be a single server or a group of server in larger projects.
- node — Responsible for running workloads. These servers are usually micro managed by the control plane and carries out various tasks following supplied instructions. Every server in you cluster will have a selected set of components. The number and type of those components can vary depending on the role a server has in your cluster. That means the nodes do not have all the components that the control plane has.
In the upcoming subsections, you'll have a more detailed look into the individual components that make up a Kubernetes cluster.
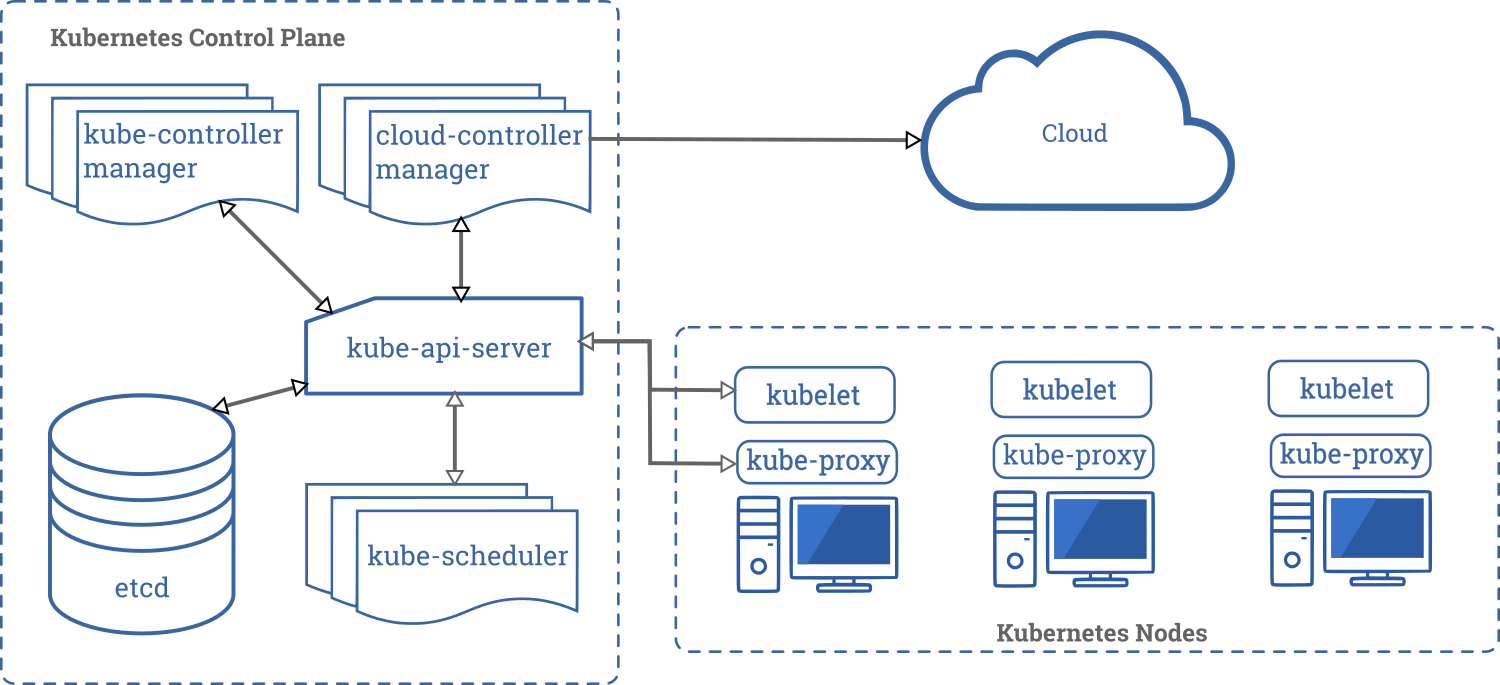
Control Plane Components
The control plane in a Kubernetes cluster consists of five components. These are as follows:
- kube-api-server: This acts as the entrance to the Kubernetes control plane, responsible for validating and processing requests delivered using client libraries like the kubectl program.
- etcd: This is a distributed key-value store which acts as the single source of truth about your cluster. It holds configuration data and information about the state of the cluster. etcd is an open-source project and is developed by the folks behind Red Hat. The source code of the project is hosted on the etcd-io/etcd GitHub repo.
- kube-controller-manager: The controllers in Kubernetes are responsible for controlling the state of the cluster. When you let Kubernetes know what you want in your cluster, the controllers make sure that your request is fulfilled. The kube-controller-manager is all the controller processes grouped into a single process.
- kube-scheduler: Assigning task to a certain node considering its available resources and the requirements of the task is known as scheduling. The kube-scheduler component does the task of scheduling in Kubernetes making sure none of the servers in the cluster is overloaded.
- cloud-controller-manager: In a real world cloud environment, this component lets you wire-up your cluster with your cloud provider's (GKE/EKS) API. This way, the components that interact with that cloud platform stays isolated from components that just interact with your cluster. In a local cluster like minikube, this component doesn't exist.
Node Components
Compared to the control plane, nodes have a very small number of components. These components are as follows:
- kubelet: This service acts as the gateway between the control plain and each of the nodes in a cluster. Every instructions from the control plain towards the nodes, passes through this service. It also interacts with the etcd store to keep the state information updated.
- kube-proxy: This small service runs on each node server and maintains network rules on them. Any network request that reaches a service inside your cluster, passes through this service.
- Container Runtime: Kubernetes is a container orchestration tool hence it runs applications in containers. This means that every node needs to have a container runtime like Docker or rkt or cri-o.
Kubernetes Objects
According to the Kubernetes documentation —
"Objects are persistent entities in the Kubernetes system. Kubernetes uses these entities to represent the state of your cluster. Specifically, they can describe what containerized applications are running, the resources available to them, and the policies around their behaviour."
When you create a Kubernetes object, you're effectively telling the Kubernetes system that you want this object to exist no matter what and the Kubernetes system will constantly work to keep the object running.
Pods
According to the Kubernetes documentation —
"Pods are the smallest deployable units of computing that you can create and manage in Kubernetes".
A pod usually encapsulates one or more containers that are closely related sharing a life cycle and consumable resources.
Although a pod can house more than one container, you shouldn't just put containers in a pod willy nilly. Containers in a pod must be so closely related, that they can be treated as a single application.
As an example, your back-end API may depend on the database but that doesn't mean you'll put both of them in the same pod. Throughout this entire article, you won't see any pod that has more than one container running.
Usually, you should not manage a pod directly. Instead, you should work with higher level objects that can provide you much better manageability. You'll learn about these higher level objects in later sections.
Services
According to the Kubernetes documentation —
"A service in Kubernetes is an abstract way to expose an application running on a set of pods as a network service".
Kubernetes pods are ephemeral in nature. They get created and after some time when they get destroyed, they do not get recycled.
Instead new identical pods take the places of the old ones. Some higher level Kubernetes objects are even capable of creating and destroying pods dynamically.
A new IP address is assigned to each pod at the time of their creation. But in case of a high level object that can create, destroy, and group together a number of pods, the set of pods running in one moment in time could be different from the set of pods running that application a moment later.
This leads to a problem: if some set of pods in your cluster depends on another set of pods within your cluster, how do they find out and keep track of each other's IP addresses?
The Kubernetes documentation says —
"a Service is an abstraction which defines a logical set of Pods and a policy by which to access them".
Which essentially means that a Service groups together a number of pods that perform the same function and presents them as a single entity.
This way, the confusion of keeping track of multiple pods goes out of the window as that single Service now acts as a sort of communicator for all of them.
In the hello-kube example, you created a LoadBalancer type of service which allows requests from outside the cluster connect to pods running inside the cluster.

Any time you need to give access to one or more pods to another application or to something outside of the cluster, you should create a service.
For instance, if you have a set of pods running web servers that should be accessible from the internet, a service will provide the necessary abstraction.
The Full Picture
Now that you have a proper understanding of the individual Kubernetes components, here is a visual representation of how they work together behind the scenes:
 https://kubernetes.io/docs/concepts/overview/components/
Before I get into explaining the individual details, have a look at what the Kubernetes documentation has to say —
https://kubernetes.io/docs/concepts/overview/components/
Before I get into explaining the individual details, have a look at what the Kubernetes documentation has to say —
"To work with Kubernetes objects – whether to create, modify, or delete them – you'll need to use the Kubernetes API. When you use the kubectl command-line interface, the CLI makes the necessary Kubernetes API calls for you."
The first command that you ran was the run command. It was as follows:
kubectl run hello-kube --image=fhsinchy/hello-kube --port=80
The run command is responsible for creating a new pod that runs the given image. Once you've issued this command, following sets of events occur inside the Kubernetes cluster:
- The kube-api-server component receives the request, validates it and processes it.
- The kube-api-server then communicates with the kubelet component on the node and provides the instructions necessary for creating the pod.
- The kubelet component then starts working on making the pod up and running and also keeps the state information updated in the etcd store. Generic syntax for the run command is as follows:
kubectl run <pod name> --image=<image name> --port=<port to expose>
You can run any valid container image inside a pod. The fhsinchy/hello-kube Docker image contains a very simple JavaScript application that runs on port 80 inside the container. The --port=80 option allows the pod to expose port 80 from inside the container.

The newly created pod runs inside the minikube cluster and is inaccessible from the outside. To expose the pod and make it accessible, the second command that you issued was as follows:
kubectl expose pod hello-kube --type=LoadBalancer --port=80
The expose command is responsible for creating a Kubernetes service of type LoadBalancer that allows users to access the application running inside the pod.
Just like the run command, the expose command execution goes through same sort of steps inside the cluster. But instead of a pod, the kube-api-server provides instructions necessary for creating a service in this case to the kubelet component.
Generic syntax for the expose command is as follows:
kubectl expose <resource kind to expose> <resource name> --type=<type of service to create> --port=<port to expose>
The object type can be any valid Kubernetes object type. The name has to match up with the object name you're trying to expose.
--type indicates the type of service you want. There are four different types of services available for internal or external networking.
 Lastly, the --port is the port number you want to expose from the running container.
Once the service has been created, the last piece of the puzzle was to access the application running inside the pod. To do that, the command you executed was as follows:
minikube service hello-kube
Unlike the previous ones, this last command doesn't go to the kube-api-server. Rather it communicates with the local cluster using the minikube program. The service command for minikube returns a full URL for a given service.
When you created the hello-kube pod with the --port=80 option, you instructed Kubernetes to let the pod expose port 80 from inside the container but it wasn't accessible from outside the cluster.
Then when you created the LoadBalancer service with the --port=80 option, it mapped port 80 from that container to an arbitrary port in the local system making it accessible from outside the cluster.
On my system, the service command returns 192.168.99.101:30848 URL for the pod. The IP in this URL is actually the IP of the minikube virtual machine. You can verify this by executing the following command:
minikube ip

# 192.168.99.101
To verify that the 30848 port points to port 80 inside the pod, you can execute the following command:
kubectl get service hello-kube

# NAME         TYPE           CLUSTER-IP     EXTERNAL-IP   PORT(S)        AGE
# hello-kube   LoadBalancer   10.109.60.75   <pending>     80:30848/TCP   119s
On the PORT(S) column, you can see that port 80 indeed maps to port 30484 on the local system. So instead of running the service command you can just inspect the IP and port and then put it into your browser manually to access the hello-kube application.
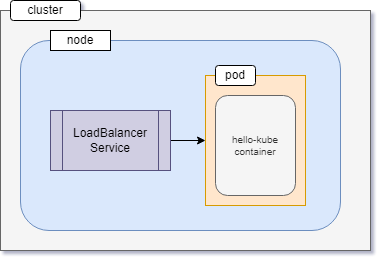
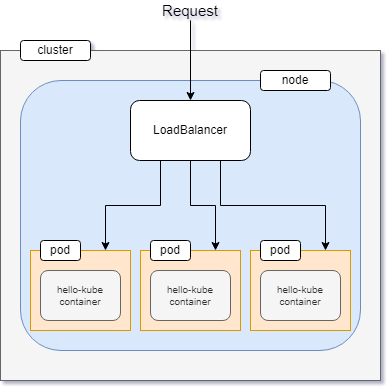
 Now, the final state of the cluster can be visualized as follows:
 If you're coming from Docker, then the significance of using a service in order to expose a pod may seem a bit too verbose to you at the moment.
But as you go into the examples that deal with more than one pod, you'll start to appreciate everything that Kubernetes has to offer.
Getting Rid of Kubernetes Resources
Now that you know how to create Kubernetes resources like pods and Services, you need to know how to get rid of them. The only way to get rid of a Kubernetes resource is to delete it.
You can do that by using the delete command for kubectl. Generic syntax of the command is as follows:
kubectl delete <resource type> <resource name>
To delete a pod named hello-kube the command will be as follows:
kubectl delete pod hello-kube

# pod "hello-kube" deleted
And to delete a service named hello-kube the command will be as follows:
kubectl delete service hello-kube

# service "hello-kube" deleted
Or if you're in a destructive mood, you can delete all objects of a kind in one go using the --all option for the delete command. Generic syntax for the option is as follows:
kubectl delete <object type> --all
So to delete all pods and services you have to execute kubectl delete pod --all and kubectl delete service --all respectively.
Declarative Deployment Approach
To be honest, the hello-kube example you just saw in the previous section is not an ideal way of performing deployment with Kubernetes.
The approach that you took in that section is an imperative approach which means you had to execute every command one after the another manually. Taking an imperative approach defies the entire point of Kubernetes.
An ideal approach to deployment with Kubernetes is the declarative approach. In it you, as a developer, let Kubernetes know the state you desire your servers to be in and Kubernetes figures out a way to implement that.
In this section you'll be deploying the same hello-kube application in a declarative approach.
If you haven't already cloned the code repository linked above, then go ahead and grab that now.
Once you have that, go inside the hello-kube directory. This directory contains the code for the hello-kube application as well as the Dockerfile for building the image.
├── Dockerfile
├── index.html
├── package.json
├── public
└── src

2 directories, 3 files
The JavaScript code lives inside the src folder but that's not of interest to you. The file you should be looking at is the Dockerfile because it can give you insight into how you should plan your deployment. The contents of the Dockerfile are as follows:
FROM node as builder

WORKDIR /usr/app

COPY ./package.json ./
RUN npm install
COPY . .
RUN npm run build

EXPOSE 80

FROM nginx
COPY --from=builder /usr/app/dist /usr/share/nginx/html
As you can see, this is a multi-staged build process.
- The first stage uses node as the base image and compiles the JavaScript application into a bunch of production ready files.
- The second stage copies the files built during the first stage, and pastes them inside the default NGINX document root. Given that the base image for the second phase is nginx, the resulting image will be an nginx image serving the files built during the first phase on port 80 (default port for nginx). Now to deploy this application on Kubernetes, you'll have to find a way to run the image as a container and make port 80 accessible from the outside world.
Writing Your First Set of Configurations
In the declarative approach, instead of issuing individual commands in the terminal, you instead write down the necessary configuration in a YAML file and feed that to Kubernetes.
In the hello-kube project directory, create another directory named k8s. k8s is short for k(ubernete = 8 character)s.
You don't need to name the folder this way, you can name it whatever you want.
It's not even necessary to keep it within the project directory. These configuration files can live anywhere in your computer, as they have no relation to the project source code.
Now inside that k8s directory, create a new file named hello-kube-pod.yaml. I will go ahead and write the code for the file first and then I'll go line by line and explain it to you. The content for this file is as follows:
apiVersion: v1
kind: Pod
metadata:
  name: hello-kube-pod
  labels:
    component: web
spec:
  containers:
    - name: hello-kube
      image: fhsinchy/hello-kube
      ports:
        - containerPort: 80
Every valid Kubernetes configuration file has four required fields. They are as follows:
- apiVersion: Which version of the Kubernetes API you're using to create this object. This value may change depending on the kind of object you are creating. For creating a Pod the required version is v1.
- kind: What kind of object you want to create. Objects in Kubernetes can be of many kinds. As you go through the article, you'll learn about a lot of them, but for now, just understand that you're creating a Pod object.
- metadata: Data that helps uniquely identify the object. Under this field you can have information like name, labels, annotation etc. The metadata.name string will show up on the terminal and will be used in kubectl commands. The key value pair under the metadata.labels field doesn't have to be components: web. You can give it any label like app: hello-kube. This value will be used as the selector when creating the LoadBalancer service very soon.
- spec: contains the state you desire for the object. The spec.containers sub-field contains information about the containers that will run inside this Pod. The spec.containers.name value is what the container runtime inside the node will assign to the newly created container. The spec.containers.image is the container image to be used for creating this container. And the spec.containers.ports field holds configuration regarding various ports configuration. containerPort: 80 indicates that you want to expose port 80 from the container. Now to feed this configuration file to Kubernetes, you'll use the apply command. Generic syntax for the command is as follows:
kubectl apply -f <configuration file>
To feed a configuration file named hello-kube-pod.yaml, the command will be as follows:
kubectl apply -f hello-kube-pod.yaml

# pod/hello-kube-pod created
To make sure that the Pod is up and running, execute the following command:
kubectl get pod

# NAME         READY   STATUS    RESTARTS   AGE
# hello-kube   1/1     Running   0          3m3s
You should see Running in the STATUS column. If you see something like ContainerCreating wait for a minute or two and check again.
Once the Pod is up and running, it's time for you to write the configuration file for the LoadBalancer service.
Create another file inside the k8s directory called hello-kube-load-balancer-service.yaml and put following code in it:
apiVersion: v1
kind: Service
metadata:
  name: hello-kube-load-balancer-service
spec:
  type: LoadBalancer
  ports:
    - port: 80
      targetPort: 80
  selector:
    component: web
Like the previous configuration file, apiVersion, kind, and metadata fields serve the same purpose here. As you can see there are no labels field inside metadata here. That's because a service selects other objects using labels, other objects don't select a service.
Remember, services set-up an access policy for other objects, other objects don't set-up an access policy for a service.
Inside the spec field you can see a new set of values. Unlike a Pod, services have four types. These are ClusterIP, NodePort, LoadBalancer, and ExternalName.
In this example, you're using the type LoadBalancer, which is the standard way for exposing a service outside the cluster. This service will give you an IP address that you can then use to connect to the applications running inside your cluster.
The LoadBalancer type requires two port values to work properly. Under the ports field, the port value is for accessing the pod itself and its value can be anything you want.
The targetPort value is the one from inside the container and has to match up with the port that you want to expose from inside the container.
I've already said that the hello-kube application runs on port 80 inside the container . You've even exposed this port in the Pod configuration file, so the targetPort will be 80.
The selector field is used to identify the objects that will be connected to this service. The component: web key-value pair has to match up with the key-value pair under the labels field in the Pod configuration file. If you've used some other key value pair like app: hello-kube in that configuration file, use that instead.
To feed this file to Kubernetes you will again use the apply command. The command for feeding a file named hello-kube-load-balancer-service.yaml will be as follows:
kubectl apply -f hello-kube-load-balancer-service.yaml

# service/hello-kube-load-balancer-service created
To make sure the load balancer has been created successfully execute the following command:
kubectl get service

# NAME                               TYPE           CLUSTER-IP       EXTERNAL-IP   PORT(S)        AGE
# hello-kube-load-balancer-service   LoadBalancer   10.107.231.120   <pending>     80:30848/TCP   7s
# kubernetes                         ClusterIP      10.96.0.1        <none>        443/TCP        21h
Make sure you see the hello-kube-load-balancer-service name in the list. Now that you have a pod running that is exposed, you can go ahead and access that. Execute the following command to do so:
minikube service hello-kube-load-balancer-service

# |-----------|----------------------------------|-------------|-----------------------------|
# | NAMESPACE |           NAME                   | TARGET PORT |             URL             |
# |-----------|----------------------------------|-------------|-----------------------------|
# | default   | hello-kube-load-balancer-service |          80 | http://192.168.99.101:30848 |
# |-----------|----------------------------------|-------------|-----------------------------|
# 🎉  Opening service default/hello-kube-load-balancer in default browser...
Your default web browser should open automatically and you should see something like this:
 You can also feed both files together instead of feeding them individually. To do that you can replace the file name with the directory name as follows:
kubectl apply -f k8s

# service/hello-kube-load-balancer-service created
# pod/hello-kube-pod created
In this case make sure your terminal is on the parent directory of the k8s directory.
If you're inside the k8s directory, you can use a dot (.) to refer to the current directory. When mass applying configurations, it can be a good idea to get rid of resources created previously. That way the possibility of conflicts becomes much lower.
The declarative approach is the ideal one when working with Kubernetes. Except for some special cases, that you'll see near the end of the article.
The Kubernetes Dashboard
In a previous section, you used the delete command to get rid of a Kubernetes object.
In this section, however, I thought introducing the dashboard would be great idea. The Kubernetes Dashboard is a graphical UI that you can use to manage your workloads, services, and more.
To launch the Kubernetes Dashboard, execute the following command in your terminal:
minikube dashboard

# 🤔 Verifying dashboard health ...
# 🚀 Launching proxy ...
# 🤔 Verifying proxy health ...
# 🎉 Opening http://127.0.0.1:52393/api/v1/namespaces/kubernetes-dashboard/services/http:kubernetes-dashboard:/proxy/ in your default browser...
The dashboard should open automatically in your default browser:
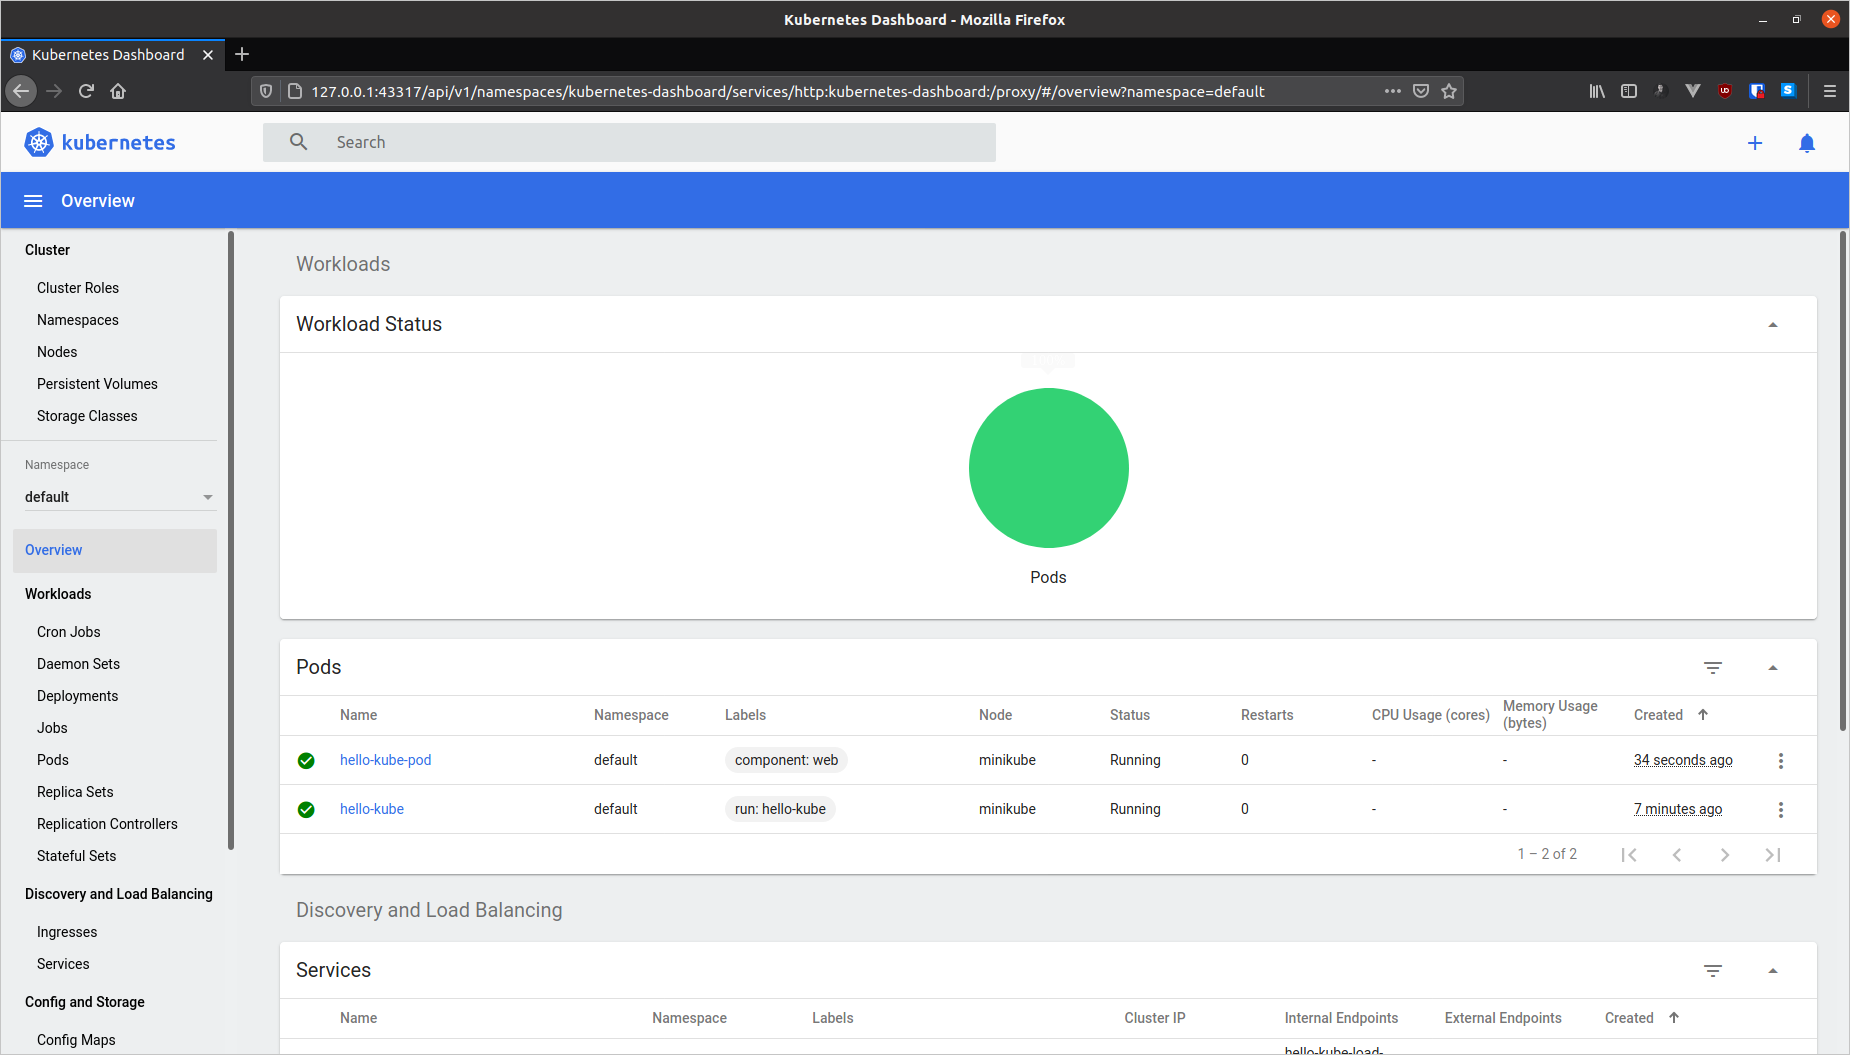 The UI is pretty user-friendly and you are free to roam around here. Although it's completely possible to create, manage, and delete objects from this UI, I'll be using the CLI for the rest of this article.
Here in the Pods list, you can use the three dots menu on the right side to Delete the Pod. You can do the same with the LoadBalancer service as well. In fact the Services list is conveniently placed right after the Pods list.
You can close the dashboard by hitting the Ctrl + C key combination or closing the terminal window.
Working with Multi-Container Applications
So far you've worked with applications that run within a single container.
In this section, you'll be working with an application consisting of two containers. You'll also get familiar with Deployment, ClusterIP, PersistentVolume, PersistentVolumeClaim and some debugging techniques.
The application you'll be working with is a simple express notes API with full CRUD functionality. The application uses PostgreSQL as its database system. So you're not only going to deploy the application but also set-up internal networking between the application and the database.
The code for the application is inside the notes-api directory inside the project repo.
.
├── api
├── docker-compose.yaml
└── postgres

2 directories, 1 file
The application source code resides inside the api directory and the postgres directory contains a Dockerfile for creating the custom postgres image. The docker-compose.yaml file contains the necessary configuration for running the application using docker-compose.
Just like with the previous project, you can look into the individual Dockerfile for each service to get a sense of how the application runs inside the container.
Or you can just inspect the docker-compose.yaml and plan your Kubernetes deployment using that.
version: "3.8"

services:
    db:
        build:
            context: ./postgres
            dockerfile: Dockerfile.dev
        environment:
            POSTGRES_PASSWORD: 63eaQB9wtLqmNBpg
            POSTGRES_DB: notesdb
    api:
        build:
            context: ./api
            dockerfile: Dockerfile.dev
        ports:
            - 3000:3000
        volumes:
            - /usr/app/node_modules
            - ./api:/usr/app
        environment:
            DB_CONNECTION: pg
            DB_HOST: db
            DB_PORT: 5432
            DB_USER: postgres
            DB_DATABASE: notesdb
            DB_PASSWORD: 63eaQB9wtLqmNBpg
Looking at the api service definition, you can see that the application runs on port 3000 inside the container. It also requires a bunch of environment variables to function properly.
The volumes can be ignored as they were necessary for development purposes only and the build configuration is Docker-specific. So the two sets of information that you can carry over to your Kubernetes configuration files almost unchanged are as follows:
- Port mappings – because you'll have to expose the same port from the container.
- Environment variables – because these variables are going to be the same across all environments (the values are going to change, though). The db service is even simpler. All it has is bunch of environment variables. You can even use the official postgres image instead of a custom one.
But the only reason for a custom image is if you want the database instance to come with the notes table pre-created.
This table is necessary for the application. If you look inside the postgres/docker-entrypoint-initdb.d directory, you'll see a file named notes.sql which is used for creating the database during initialization.
Deployment Plan
Unlike the previous project you deployed, this project is going to be a bit more complicated.
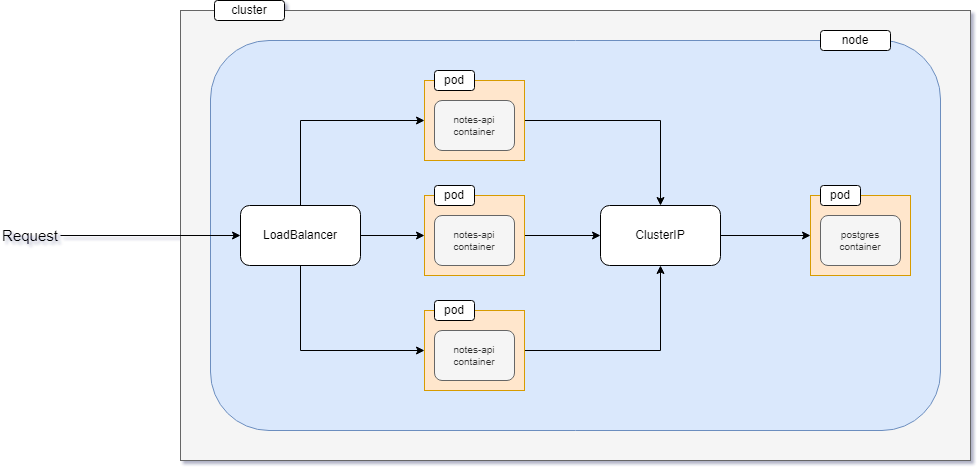
In this project, you'll create not one but three instances of the notes API. These three instances will be exposed outside of the cluster using a LoadBalancer service.
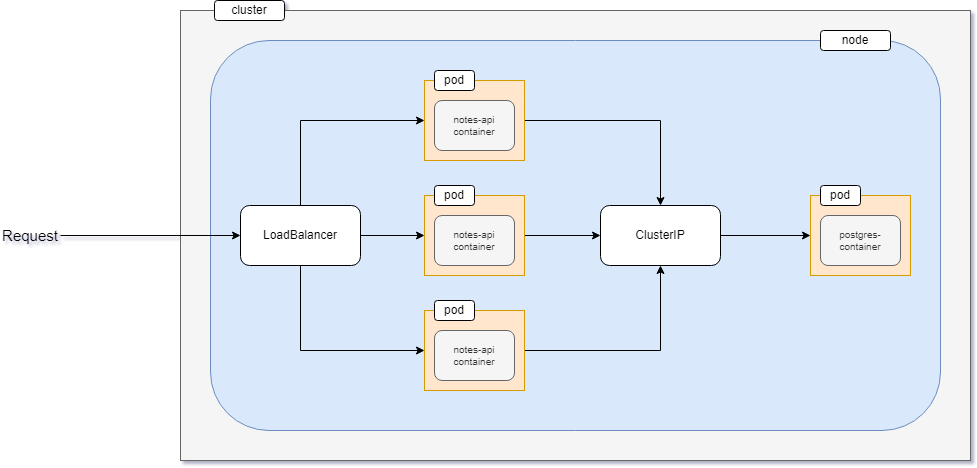 Apart from these three instances, there will be another instance of the PostgreSQL database system. All three instances of the notes API application will communicate with this database instance using a ClusterIP service.
ClusterIP service is another type of Kubernetes service that exposes an application within your cluster. That means no outside traffic can reach the application using a ClusterIP service.
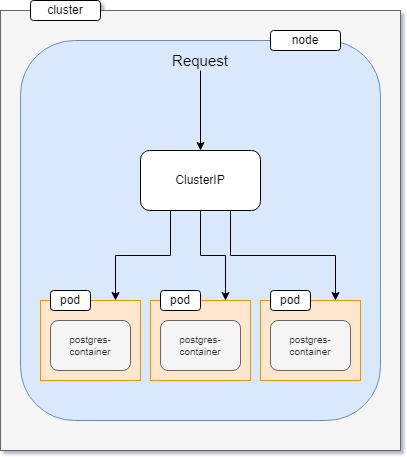 In this project, the database has to be accessed by the notes API only, so exposing the database service within the cluster is an ideal choice.
I've already mentioned in a previous section that you shouldn't create pods directly. So in this project, you'll be using a Deployment instead of a Pod.
Replication Controllers, Replica Sets, and Deployments According to the Kubernetes documentation -
"In Kubernetes, controllers are control loops that watch the state of your cluster, then make or request changes where needed. Each controller tries to move the current cluster state closer to the desired state. A control loop is a non-terminating loop that regulates the state of a system."
A ReplicationController, as the name suggests allows you to easily create multiple replicas very easily. Once the desired number of replicas are created, the controller will make sure that the state stays that way.
If after some time you decide to lower the number of replicas, then the ReplicationController will take actions immediately and get rid of the extra pods.
Otherwise if the number of replicas becomes lower than what you wanted (maybe some of the pods have crashed) the ReplicationController will create new ones to match the desired state.
As useful as they may sound to you, the ReplicationController is not the recommended way of creating replicas nowadays. A newer API called a ReplicaSet has taken the place.
Apart from the fact that a ReplicaSet can provide you with a wider range of selection option, both ReplicationController and ReplicaSet are more or less the same thing.
Having a wider range of selector options is good but what's even better is having more flexibility in terms of rolling out and rolling back updates. This is where another Kubernetes API called a Deployment comes in.
A Deployment is like an extension to the already nice ReplicaSet API. Deployment not only allows you to create replicas in no time, but also allows you to release updates or go back to a previous function with just one or two kubectl commands.
REPLICATIONCONTROLLER REPLICASET DEPLOYMENT
Allows the creation of multiple pods easily Allows the creation of multiple pods easily Allows the creation of multiple pods easily The original method of replication in Kubernetes Has more flexible selectors Extends ReplicaSets with easy update roll-out and roll-back In this project, you'll be using a Deployment to maintain the application instances.
Creating Your First Deployment
Let's begin by writing the configuration file for the notes API deployment. Create a k8s directory inside the notes-api project directory.
Inside that directory, create a file named api-deployment.yaml and put following content in it:
apiVersion: apps/v1
kind: Deployment
metadata:
  name: api-deployment
spec:
  replicas: 3
  selector:
    matchLabels:
      component: api
  template:
    metadata:
      labels:
        component: api
    spec:
      containers:
        - name: api
          image: fhsinchy/notes-api
          ports:
            - containerPort: 3000
In this file, the apiVersion, kind, metadata and spec fields serve the same purpose as the previous project. Notable changes in this file from the last one are as follows:
- For creating a Pod, the required apiVersion was v1. But for creating a Deployment, the required version is apps/v1. Kubernetes API versions can be a bit confusing at times, but as you keep working with Kubernetes you'll get the hang of them. Also you can consult the official docs for example YAML files to refer to. The kind is Deployment which is pretty self-explanatory.
- spec.replicas defines the number of running replicas. Setting this value to 3 means you let Kubernetes know that you want three instances of your application running at all times.
- spec.selector is where you let the Deployment know which pods to control. I've already mentioned that a Deployment is an extension to ReplicaSet and can control a set of Kubernetes objects. Setting selector.matchLabels to component: api means this Deployment will control the pods that have a label of component: api. This line is letting Kubernetes know that you want this Deployment to control all the pods having the component: api label.
- spec.template is the template for configuring the pods. It's almost the same as the previous configuration file. Now to see this configuration in action, apply the file just like in the previous project:
kubectl apply -f api-deployment.yaml

# deployment.apps/api-deployment created
To make sure the Deployment has been created, execute the following command:
kubectl get deployment

# NAME             READY   UP-TO-DATE   AVAILABLE   AGE
# api-deployment   0/3     3            0           2m7s
If you look at the READY column, you'll see 0/3. This means the pods have not been created yet. Wait a few minutes and try once again.
kubectl get deployment

# NAME             READY   UP-TO-DATE   AVAILABLE   AGE
# api-deployment   0/3     3            0           28m
As you can see, I have waited nearly half an hour and still none of the pods are ready. The API itself is only a few hundred kilobytes. A deployment of this size shouldn't have taken this long. Which means there is a problem and we have to fix that.
Inspecting Kubernetes Resources
Before you can solve a problem, you have to first find out the origin. A good starting point is the get command.
You already know the get command that prints a table containing important information about one or more Kubernetes resources. Generic syntax of the command is as follows:
kubectl get <resource type> <resource name>
To run the get command on your api-deployment, execute the following line of code in your terminal:
kubectl get deployment api-deployment

# NAME             READY   UP-TO-DATE   AVAILABLE   AGE
# api-deployment   0/3     3            0           15m
You can omit the api-deployment name to get a list of all available deployments. You can also run the get command on a configuration file.
If you would like to get information about the deployments described in the api-deployment.yaml file, the command should be as follows:
kubectl get -f api-deployment

# NAME             READY   UP-TO-DATE   AVAILABLE   AGE
# api-deployment   0/3     3            0           18m
By default, the get command shows a very small amount of information. You can get more out of it by using the -o option.
The -o option sets the output format for the get command. You can use the wide output format to see more details.
kubectl get -f api-deployment.yaml

# NAME             READY   UP-TO-DATE   AVAILABLE   AGE   CONTAINERS   IMAGES               SELECTOR
# api-deployment   0/3     3            0           19m   api          fhsinchy/notes-api   component=api
As you can see, now the list contains more information than before. You can learn about the options for the get command from the official docs.
Running get on the Deployment doesn't spit out anything interesting, to be honest. In such cases, you have to get down to the lower level resources.
Have a look at the pods list and see if you can find something interesting there:
kubectl get pod

# NAME                             READY   STATUS             RESTARTS   AGE
# api-deployment-d59f9c884-88j45   0/1     CrashLoopBackOff   10         30m
# api-deployment-d59f9c884-96hfr   0/1     CrashLoopBackOff   10         30m
# api-deployment-d59f9c884-pzdxg   0/1     CrashLoopBackOff   10         30m
Now this is interesting. All the pods have a STATUS of CrashLoopBackOff which is new. Previously you've only seen ContainerCreating and Running statuses. You may see Error in place of CrashLoopBackOff as well.
Looking at the RESTARTS column you can see that the pods have been restarted 10 times already. This means for some reason the pods are failing to startup.
Now to get a more detailed look at one of the pods, you can use another command called describe. It's a lot like the get command. Generic syntax of the command is as follows:
kubectl get <resource type> <resource name>
To get details of the api-deployment-d59f9c884-88j45 pod, you can execute the following command:
kubectl describe pod api-deployment-d59f9c884-88j45

# Name:         api-deployment-d59f9c884-88j45
# Namespace:    default
# Priority:     0
# Node:         minikube/172.28.80.217
# Start Time:   Sun, 09 Aug 2020 16:01:28 +0600
# Labels:       component=api
#               pod-template-hash=d59f9c884
# Annotations:  <none>
# Status:       Running
# IP:           172.17.0.4
# IPs:
#   IP:           172.17.0.4
# Controlled By:  ReplicaSet/api-deployment-d59f9c884
# Containers:
#  api:
#     Container ID:   docker://d2bc15bda9bf4e6d08f7ca8ff5d3c8593655f5f398cf8bdd18b71da8807930c1
#     Image:          fhsinchy/notes-api
#     Image ID:       docker-pullable://fhsinchy/notes-api@sha256:4c715c7ce3ad3693c002fad5e7e7b70d5c20794a15dbfa27945376af3f3bb78c
#     Port:           3000/TCP
#     Host Port:      0/TCP
#     State:          Waiting
#       Reason:       CrashLoopBackOff
#     Last State:     Terminated
#       Reason:       Error
#       Exit Code:    1
#       Started:      Sun, 09 Aug 2020 16:13:12 +0600
#       Finished:     Sun, 09 Aug 2020 16:13:12 +0600
#     Ready:          False
#     Restart Count:  10
#     Environment:    <none>
#     Mounts:
      /var/run/secrets/kubernetes.io/serviceaccount from default-token-gqfr4 (ro)
# Conditions:
#   Type              Status
#   Initialized       True
#   Ready             False
#   ContainersReady   False
#   PodScheduled      True
# Volumes:
#   default-token-gqfr4:
#     Type:        Secret (a volume populated by a Secret)
#     SecretName:  default-token-gqfr4
#     Optional:    false
# QoS Class:       BestEffort
# Node-Selectors:  <none>
# Tolerations:     node.kubernetes.io/not-ready:NoExecute for 300s
#                  node.kubernetes.io/unreachable:NoExecute for 300s
# Events:
#   Type     Reason     Age                         From               Message
#   ----     ------     ----                        ----               -------
#   Normal   Scheduled  <unknown>                   default-scheduler  Successfully assigned default/api-deployment-d59f9c884-88j45 to minikube
#   Normal   Pulled     2m40s (x4 over 3m47s)       kubelet, minikube  Successfully pulled image "fhsinchy/notes-api"
#   Normal   Created    2m40s (x4 over 3m47s)       kubelet, minikube  Created container api
#   Normal   Started    2m40s (x4 over 3m47s)       kubelet, minikube  Started container api
#   Normal   Pulling    107s (x5 over 3m56s)        kubelet, minikube  Pulling image "fhsinchy/notes-api"
#   Warning  BackOff    <invalid> (x44 over 3m32s)  kubelet, minikube  Back-off restarting failed container
The most interesting part in this entire wall of text is the Events section. Have a closer look:

Events:
  Type     Reason     Age                         From               Message
  ----     ------     ----                        ----               -------
  Normal   Scheduled  <unknown>                   default-scheduler  Successfully assigned default/api-deployment-d59f9c884-88j45 to minikube
  Normal   Pulled     2m40s (x4 over 3m47s)       kubelet, minikube  Successfully pulled image "fhsinchy/notes-api"
  Normal   Created    2m40s (x4 over 3m47s)       kubelet, minikube  Created container api
  Normal   Started    2m40s (x4 over 3m47s)       kubelet, minikube  Started container api
  Normal   Pulling    107s (x5 over 3m56s)        kubelet, minikube  Pulling image "fhsinchy/notes-api"
  Warning  BackOff    <invalid> (x44 over 3m32s)  kubelet, minikube  Back-off restarting failed container
From these events, you can see that the container image was pulled succesfully. The container was created as well, but it's evident from the Back-off restarting failed container that the container failed to startup.
The describe command is very similar to the get command and has the same sort of options.
You can omit the api-deployment-d59f9c884-88j45 name to get information about all available pods. Or you can also use the -f option to pass a configuration file to the command. Visit the official docs to learn more.
Now that you know that there is something wrong with the container, you have to go down to the container level and see what's going on there.
Getting Container Logs from Pods
There is another kubectl command called logs that can help you to get the container logs from inside a pod. Generic syntax for the command is as follows:
kubectl logs <pod>
To view the logs inside the api-deployment-d59f9c884-88j45 pod, the command should be as follows:
kubectl logs api-deployment-d59f9c884-88j45

# > api@1.0.0 start /usr/app
# > cross-env NODE_ENV=production node bin/www

# /usr/app/node_modules/knex/lib/client.js:55
#     throw new Error(`knex: Required configuration option 'client' is missing.`);
    ^

# Error: knex: Required configuration option 'client' is missing.
#     at new Client (/usr/app/node_modules/knex/lib/client.js:55:11)
#     at Knex (/usr/app/node_modules/knex/lib/knex.js:53:28)
#     at Object.<anonymous> (/usr/app/services/knex.js:5:18)
#     at Module._compile (internal/modules/cjs/loader.js:1138:30)
#     at Object.Module._extensions..js (internal/modules/cjs/loader.js:1158:10)
#     at Module.load (internal/modules/cjs/loader.js:986:32)
#     at Function.Module._load (internal/modules/cjs/loader.js:879:14)
#     at Module.require (internal/modules/cjs/loader.js:1026:19)
#     at require (internal/modules/cjs/helpers.js:72:18)
#     at Object.<anonymous> (/usr/app/services/index.js:1:14)
# npm ERR! code ELIFECYCLE
# npm ERR! errno 1
# npm ERR! api@1.0.0 start: `cross-env NODE_ENV=production node bin/www`
# npm ERR! Exit status 1
# npm ERR!
# npm ERR! Failed at the api@1.0.0 start script.
# npm ERR! This is probably not a problem with npm. There is likely additional logging output above.

# npm ERR! A complete log of this run can be found in:
# npm ERR!     /root/.npm/_logs/2020-08-09T10_28_52_779Z-debug.log
Now this is what you need to debug the problem. Looks like the knex.js library is missing a required value, which is preventing the application from starting. You can learn more about the logs command from the official docs.
This is happening because you're missing some required environment variables in the deployment definition.
If you take another look at the api service definition inside the docker-compose.yaml file, you should see something like this:
    api:
        build:
            context: ./api
            dockerfile: Dockerfile.dev
        ports:
            - 3000:3000
        volumes:
            - /usr/app/node_modules
            - ./api:/usr/app
        environment:
            DB_CONNECTION: pg
            DB_HOST: db
            DB_PORT: 5432
            DB_USER: postgres
            DB_DATABASE: notesdb
            DB_PASSWORD: 63eaQB9wtLqmNBpg
These environment variables are required for the application to communicate with the database. So adding these to the deployment configuration should fix the issue.
Environment Variables
Adding environment variables to a Kubernetes configuration file is very straightforward. Open up the api-deployment.yaml file and update its content to look like this:
apiVersion: apps/v1
kind: Deployment
metadata:
  name: api-deployment
spec:
  replicas: 3
  selector:
    matchLabels:
      component: api
  template:
    metadata:
      labels:
        component: api
    spec:
      containers:
        - name: api
          image: fhsinchy/notes-api
          ports:
            - containerPort: 3000

          # these are the environment variables
          env:
            - name: DB_CONNECTION
              value: pg
The containers.env field contains all the environment variables. If you look closely, you'll see that I haven't added all the environment variables from the docker-compose.yaml file. I have added only one.
The DB_CONNECTION indicates that the application is using a PostgreSQL database. Adding this single variable should fix the problem.
Now apply the configuration file again by executing the following command:
kubectl apply -f api-deployment.yaml

# deployment.apps/api-deployment configured
Unlike the other times, the output here says that a resource has been configured. This is the beauty of Kubernetes. You can just fix issues and re-apply the same configuration file immediately.
Now use the get command once more to make sure everything is running properly.
kubectl get deployment

# NAME             READY   UP-TO-DATE   AVAILABLE   AGE
# api-deployment   3/3     3            3           68m

kubectl get pod

# NAME                              READY   STATUS    RESTARTS   AGE
# api-deployment-66cdd98546-l9x8q   1/1     Running   0          7m26s
# api-deployment-66cdd98546-mbfw9   1/1     Running   0          7m31s
# api-deployment-66cdd98546-pntxv   1/1     Running   0          7m21s
All three pods are running and the Deployment is running fine as well.
Creating the Database Deployment
Now that the API is up and running, it's time to write the configuration for the database instance.
Create another file called postgres-deployment.yaml inside the k8s directory and put the following content in it:
apiVersion: apps/v1
kind: Deployment
metadata:
  name: postgres-deployment
spec:
  replicas: 1
  selector:
    matchLabels:
      component: postgres
  template:
    metadata:
      labels:
        component: postgres
    spec:
      containers:
        - name: postgres
          image: fhsinchy/notes-postgres
          ports:
            - containerPort: 5432
          env:
            - name: POSTGRES_PASSWORD
              value: 63eaQB9wtLqmNBpg
            - name: POSTGRES_DB
              value: notesdb
The configuration itself is very similar to the previous one. I am not going to explain everything in this file – hopefully you understand it by yourself with the knowledge you've gained from this article so far.
PostgreSQL runs on port 5432 by default, and the POSTGRES_PASSWORD variable is required for running the postgres container. This password will also be used for connecting to this database by the API.
The POSTGRES_DB variable is optional. But because of the way this project has been structured, it's necessary here – otherwise the initialization will fail.
You can learn more about the official postgres Docker image from their Docker Hub page. For the sake of simplicity, I'm keeping the replica count to 1 in this project.
To apply this file, execute the following command:
kubectl apply -f postgres-deployment.yaml

# deployment.apps/postgres-deployment created
Use the get command to ensure that the deployment and the pods are running properly:
kubectl get deployment

# NAME                  READY   UP-TO-DATE   AVAILABLE   AGE
# postgres-deployment   1/1     1            1           13m

kubectl get pod

# NAME                                   READY   STATUS    RESTARTS   AGE
# postgres-deployment-76fcc75998-mwnb7   1/1     Running   0          13m
Although the deployment and the pods are running properly, there is a big issue with the database deployment.
If you've worked with any database system before, you may already know that databases store data in the filesystem. Right now the database deployment looks like this:
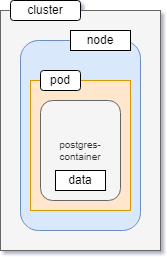 The postgres container is encapsulated by a pod. Whatever data is saved stays within the internal filesystem of the container.
Now, if for some reason, the container crashes or the pod encapsulating the container goes down, all data persisted inside the filesystem will be lost.
Upon crashing, Kubernetes will create a new pod to maintain the desired state, but there is no data carry over mechanism between the two pods whatsoever.
To solve this issue, you can store the data in a separate space outside the pod within the cluster.
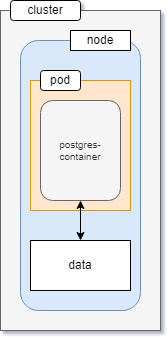 Managing such storage is a distinct problem from managing compute instances. The PersistentVolume subsystem in Kubernetes provides an API for users and administrators that abstracts details of how storage is provided from how it is consumed.
Persistent Volumes and Persistent Volume Claims
According to the Kubernetes documentation —
"A PersistentVolume (PV) is a piece of storage in the cluster that has been provisioned by an administrator or dynamically provisioned using a StorageClass. It is a resource in the cluster just like a node is a cluster resource."
Which essentially means that a PersistentVolume is a way to take a slice from your storage space and reserve that for a certain pod. Volumes are always consumed by pods and not some high level object like a deployment.
If you want to use a volume with a deployment that has multiple pods, you'll have to go through some additional steps.
Create a new file called database-persistent-volume.yaml inside the k8s directory and put following content in that file:
apiVersion: v1
kind: PersistentVolume
metadata:
  name: database-persistent-volume
spec:
  storageClassName: manual
  capacity:
    storage: 5Gi
  accessModes:
    - ReadWriteOnce
  hostPath:
    path: "/mnt/data"
The apiVersion, kind, and metadata serve the same purpose as any other configuration file. The spec field, however, contains some new fields.
- spec.storageClassName indicates the class name for this volume. Assume that a cloud provider has three kinds of storage available. These can be slow, fast, and very fast. The kind of storage you get from the provider will depend on the amount of money you're paying. If you ask for a very fast storage, you'll have to pay more. These different types of storage are the classes. I am using manual as an example here. You can use whatever you like in your local cluster.
- spec.capacity.storage is the amount of storage this volume will have. I am giving it 5 gigabytes of storage in this project.
- spec.accessModes sets the access mode for the volume. There are three possible access modes. ReadWriteOnce means the volume can be mounted as read-write by a single node. ReadWriteMany on the other hand means the volume can be mounted as read-write by many nodes. ReadOnlyMany means the volume can be mounted read-only by many nodes.
- spec.hostPath is something development specific. It indicates the directory in your local single node cluster that'll be treated as persistent volume. /mnt/data means that the data saved in this persistent volume will live inside the /mnt/data directory in the cluster. To apply this file, execute the following command:
kubectl apply -f database-persistent-volume.yaml

# persistentvolume/database-persistent-volume created
Now use the get command to verify that the volume has been created:
kubectl get persistentvolume

# NAME                         CAPACITY   ACCESS MODES   RECLAIM POLICY   STATUS      CLAIM   STORAGECLASS   REASON   AGE
# database-persistent-volume   5Gi        RWO            Retain           Available           manual                  58s
Now that the persistent volume has been created, you need a way to let the postgres pod access it. This is where a PersistentVolumeClaim (PVC) comes in.
A persistent volume claim is a request for storage by a pod. Assume that in a cluster, you have quite a lot of volumes. This claim will define the characteristics that a volume must meet to be able to satisfy a pods' necessities.
A real-life example can be you buying an SSD from a store. You go to the store and the salesperson shows you the following models:
MODEL 1 MODEL 2 MODEL 3 128GB 256GB 512GB SATA NVME SATA Now, you claim for a model that has at least 200GB of storage capacity and is an NVME drive.
The first one has less than 200GB and is SATA, so it doesn't match your claim. The third one has more than 200GB, but is not NVME. The second one however has more than 200GB and is also an NVME. So that's the one you get.
The SSD models that the salesperson showed you are equivalent to persistent volumes and your requirements are equivalent to persistent volume claims.
Create another new file called database-persistent-volume-claim.yaml inside the k8s directory and put the following content in that file:
apiVersion: v1
kind: PersistentVolumeClaim
metadata:
  name: database-persistent-volume-claim
spec:
  storageClassName: manual
  accessModes:
    - ReadWriteOnce
  resources:
    requests:
      storage: 2Gi
Again, the apiVersion, kind, and metadata serve the same purpose as any other configuration file.
- spec.storageClass in a claim configuration file indicates the type of storage this claim wants. That means any PersistentVolume that has spec.storageClass set to manual is suitable to be consumed by this claim. If you have multiple volumes with the manual class, the claim will get any one of them and if you have no volume with manual class – a volume will be provisioned dynamically.
- spec.accessModes again sets the access mode here. This indicates that this claim wants a storage that has an accessMode of ReadWriteOnce. Assume that you have two volumes with class set to manual. One of them has its accessModes set to ReadWriteOnce and the other one to ReadWriteMany. This claim will get the one with ReadWriteOnce.
- resources.requests.storage is the amount of storage this claim wants. 2Gi doesn't mean the given volume must have exactly 2 gigabytes of storage capacity. It means that it must have at least 2 gigabytes. I hope you remember that you set the capacity of the persistent volume to be 5 gigabytes, which is more than 2 gigabytes. To apply this file, execute the following command:
kubectl apply -f database-persistent-volume-claim.yaml

# persistentvolumeclaim/database-persistent-volume-claim created
Now use the get command to verify that the volume has been created:
kubectl get persistentvolumeclaim

# NAME                               STATUS   VOLUME                       CAPACITY   ACCESS MODES   STORAGECLASS   AGE
# database-persistent-volume-claim   Bound    database-persistent-volume   5Gi        RWO            manual         37s
Look at the VOLUME column. This claim is bound to the database-persistent-volume persistent volume that you created earlier. Also look at the CAPACITY. It's 5Gi, because the claim requested a volume with at least 2 gigabytes of storage capacity.
Dynamic Provisioning of Persistent Volumes
In the previous sub-section, you've made a persistent volume and then created a claim. But, what if there isn't any persistent volume previously provisioned?
In such cases, a persistent volume compatible with the claim will be provisioned automatically.
To begin this demonstration, remove the previously created persistent volume and the persistent volume claim with the following commands:
kubectl delete persistentvolumeclaim --all

# persistentvolumeclaim "database-persistent-volume-claim" deleted

kubectl delete persistentvolumeclaim --all

# persistentvolume "database-persistent-volume" deleted
Open up the database-persistent-volume-claim.yaml file and update its content to be as follows:
apiVersion: v1
kind: PersistentVolumeClaim
metadata:
  name: database-persistent-volume-claim
spec:
  accessModes:
    - ReadWriteOnce
  resources:
    requests:
      storage: 2Gi
I've removed the spec.storageClass field from the file. Now re-apply the database-persistent-volume-claim.yaml file without applying the database-persistent-volume.yaml file:
kubectl apply -f database-persistent-volume-claim.yaml

# persistentvolumeclaim/database-persistent-volume-claim created
Now use the get command to look at the claim information:
kubectl get persistentvolumeclaim

# NAME                               STATUS   VOLUME                                     CAPACITY   ACCESS MODES   STORAGECLASS   AGE
# database-persistent-volume-claim   Bound    pvc-525ae8af-00d3-4cc7-ae47-866aa13dffd5   2Gi        RWO            standard       2s
As you can see, a volume with pvc-525ae8af-00d3-4cc7-ae47-866aa13dffd5 name and storage capacity of 2Gi has been provisioned and bound to the claim dynamically.
You can either use a static or dynamically provisioned persistent volume for the rest of this project. I'll be using a dynamically provisioned one.
Connecting Volumes with Pods
Now that you have created a persistent volume and a claim, it's time to let the database pod use this volume.
You do this by connecting the pod to the persistent volume claim you made in the previous sub-section. Open up the postgres-deployment.yaml file and update its content to be as follows:
apiVersion: apps/v1
kind: Deployment
metadata:
  name: postgres-deployment
spec:
  replicas: 1
  selector:
    matchLabels:
      component: postgres
  template:
    metadata:
      labels:
        component: postgres
    spec:
      # volume configuration for the pod
      volumes:
        - name: postgres-storage
          persistentVolumeClaim:
            claimName: database-persistent-volume-claim
      containers:
        - name: postgres
          image: fhsinchy/notes-postgres
          ports:
            - containerPort: 5432
          # volume mounting configuration for the container
          volumeMounts:
            - name: postgres-storage
              mountPath: /var/lib/postgresql/data
              subPath: postgres
          env:
            - name: POSTGRES_PASSWORD
              value: 63eaQB9wtLqmNBpg
            - name: POSTGRES_DB
              value: notesdb
I've added two new fields in this configuration file.
- spec.volumes field contains the necessary information for the pod to find the persistent volume claim. spec.volumes.name can be anything you want. spec.volumes.persistentVolumeClaim.claimName has to match the metadata.name value from the database-persistent-volume-claim.yaml file.
- containers.volumeMounts contains information necessary for mounting the volume inside the container. containers.volumeMounts.name has to match the value from spec.volumes.name. containers.volumeMounts.mountPath indicates the directory where this volume will be mounted. /var/lib/postgresql/data is the default data directory for PostgreSQL. containers.volumeMounts.subPath indicates a directory that will be created inside the volume. Assume that you're using the same volume with other pods as well. In that case you can put pod-specific data inside another directory inside that volume. All data saved inside the /var/lib/postgresql/data directory will go inside a postgres directory within the volume. Now re-apply the postgres-deployment.yaml file by executing the following command:
kubectl apply -f postgres-deployment.yaml

# deployment.apps/postgres-deployment configured
Now you have a proper database deployment with a much smaller risk of data loss.
One thing that I would like to mention here is that the database deployment in this project has only one replica. If there were more than one replica, things would have been different.
Multiple pods accessing the same volume without them knowing about each others' existence can bring catastrophic results. In such cases creating sub directories for the pods inside that volume can be a good idea.
Wiring Everything Up
Now that you have both the API and database running, it's time to finish some unfinished business and set-up the networking.
You've already learned in previous sections that to set up networking in Kubernetes, you use services. Before you start writing the services, have a look at the networking plan that I have for this project.
- The database will only be exposed within the cluster using a ClusterIP service. No external traffic will be allowed.
- The API deployment, however, will be exposed to the outside world. Users will communicate with the API and the API will communicate with the database. You've previously worked with a LoadBalancer service that exposes an application to the outside world. The ClusterIP on the other hand exposes an application within the cluster and allows no outside traffic.
 Given that the database service should be available only within the cluster, a ClusterIP service is the perfect fit for this scenario.
Create a new file called postgres-cluster-ip-service.yaml inside the k8s directory and put following content in it:
apiVersion: v1
kind: Service
metadata:
  name: postgres-cluster-ip-service
spec:
  type: ClusterIP
  selector:
    component: postgres
  ports:
    - port: 5432
      targetPort: 5432
As you can see, the configuration file for a ClusterIP is identical to one for a LoadBalancer. The only thing that differs is the spec.type value.
You should be able to interpret this file without any trouble by now. 5432 is the default port that PostgreSQL runs on. That's why that port has to be exposed.
The next configuration file is for the LoadBalancer service, responsible for exposing the API to the outside world. Create another file called api-load-balancer-service.yaml and put the following content in it:
apiVersion: v1
kind: Service
metadata:
  name: api-load-balancer-service
spec:
  type: LoadBalancer
  ports:
    - port: 3000
      targetPort: 3000
  selector:
    component: api
This configuration is identical to the one you've written in a previous section. The API runs in port 3000 inside the container and that's why that port has to be exposed.
The last thing to do is to add the rest of the environment variables to the API deployment. So open up the api-deployment.yaml file and update its content like this:
apiVersion: apps/v1
kind: Deployment
metadata:
  name: api-deployment
spec:
  replicas: 3
  selector:
    matchLabels:
      component: api
  template:
    metadata:
      labels:
        component: api
    spec:
      containers:
        - name: api
          image: fhsinchy/notes-api
          ports:
            - containerPort: 3000
          env:
            - name: DB_CONNECTION
              value: pg
            - name: DB_HOST
              value: postgres-cluster-ip-service
            - name: DB_PORT
              value: '5432'
            - name: DB_USER
              value: postgres
            - name: DB_DATABASE
              value: notesdb
            - name: DB_PASSWORD
              value: 63eaQB9wtLqmNBpg
Previously there was just the DB_CONNECTION variable under spec.containers.env. The new variables are as follows:
- DB_HOST indicates the host address for the database service. In a non-containerized environment the value is usually 127.0.0.1. But in a Kubernetes environment, you don't know the IP address of the database pod. Hence you just use the service name that exposes the database instead.
- DB_PORT is the port exposed from the database service, which is 5432.
- DB_USER is the user for connecting to the database. postgres is the default username.
- DB_DATABASE is the database that the API will connect to. This has to match with the spec.containers.env.DB_DATABASE value from the postgres-deployment.yaml file.
- DB_PASSWORD is the password for connecting to the database. This has to match with the spec.containers.env.DB_PASSWORD value from the postgres-deployment.yaml file. With that done, now you're ready to test out the API. Before you do that, I'll suggest applying all the configuration files once again by executing the following command:
kubectl apply -f k8s

# deployment.apps/api-deployment created
# service/api-load-balancer-service created
# persistentvolumeclaim/database-persistent-volume-claim created
# service/postgres-cluster-ip-service created
# deployment.apps/postgres-deployment created
If you face any errors, just delete all resources and re-apply the files. The services, the persistent volumes, and the persistent volume claims should be created instantly.
Use the get command to make sure the deployments are all up and running:
kubectl get deployment

# NAME                  READY   UP-TO-DATE   AVAILABLE   AGE
# api-deployment        3/3     3            3           106s
# postgres-deployment   1/1     1            1           106s
As you can see from the READY column, all the pods are up and running. To access the API, use the service command for minikube.
minikube service api-load-balancer-service

# |-----------|---------------------------|-------------|-----------------------------|
# | NAMESPACE |           NAME            | TARGET PORT |             URL             |
# |-----------|---------------------------|-------------|-----------------------------|
# | default   | api-load-balancer-service |        3000 | http://172.19.186.112:31546 |
# |-----------|---------------------------|-------------|-----------------------------|
# * Opening service default/api-load-balancer-service in default browser...
The API should open automatically in your default browser:
 This is the default response for the API. You can also use http://172.19.186.112:31546/ with some API testing tool like Insomnia or Postman to test out the API. The API has full CRUD functionality.
You can see the tests that come with the API source code as documentation. Just open up the api/tests/e2e/api/routes/notes.test.js file. You should be able to understand the file without much hassle if you have experience with JavaScript and express.
Working with Ingress Controllers
So far in this article, you've used ClusterIP to expose an application within the cluster and LoadBalancer to expose an application outside the cluster.
Although I've cited LoadBalancer as the standard service kind for exposing an application outside the cluster, it has some cons.
When using LoadBalancer services to expose applications in cloud environment, you'll have to pay for each exposed services individually which can be expensive in case of huge projects.
There is another kind of service called NodePort that can be used as an alternative to the LoadBalancer kind of services.
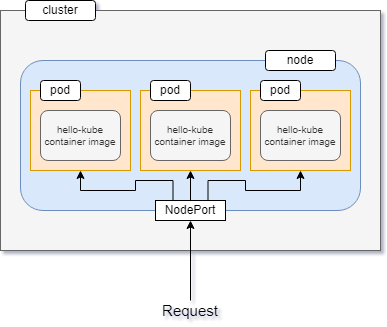 NodePort opens a specific port on all the nodes in your cluster, and handles any traffic that comes through that open port.
As you already know, services group together a number of pods, and control the way they can be accessed. So any request that reaches the service through the exposed port will end up in the correct pod.
An example configuration file for creating a NodePort can be as follows:
apiVersion: v1
kind: Service
metadata:
  name: hello-kube-node-port
spec:
  type: NodePort
  ports:
    - port: 8080
      targetPort: 8080
      nodePort: 31515
  selector:
    component: web
The spec.ports.nodePort field here must have a value between 30000 and 32767. This range is out of the well-known ports usually used by various services but is also unusual. I mean how many times do you see a port with so many digits?
You can try to replace the LoadBalancer services you created in the previous sections with a NodePort service. This shouldn't be tough and can be treated as a test for what you've learned so far.
To solve the issues I've mentioned the Ingress API was created. To be very clear, Ingress is actually not a type of service. Instead, it sits in front of multiple services and acts as a router of sorts.
An IngressController is required to work with Ingress resources in your cluster. A list of avalable ingress controllers can be found in the Kubernetes documentation.
Setting up NGINX Ingress Controller
In this example, you'll extend the notes API by adding a front end to it. And instead of using a service like LoadBalancer or NodePort, you'll use Ingress to expose the application.
The controller you'll be using is the NGINX Ingress Controller because NGINX will be used for routing requests to different services here. The NGINX Ingress Controller makes it very easy to work with NGINX configurations in a Kubernetes cluster.
The code for the project lives inside the fullstack-notes-application directory.
.
├── api
├── client
├── docker-compose.yaml
├── k8s
│   ├── api-deployment.yaml
│   ├── database-persistent-volume-claim.yaml
│   ├── postgres-cluster-ip-service.yaml
│   └── postgres-deployment.yaml
├── nginx
└── postgres

5 directories, 1 file
You'll see a k8s directory in there. It contains all the configuration files you wrote in the last sub-section, except the api-load-balancer-service.yaml file.
The reason for that is, in this project, the old LoadBalancer service will be replaced with an Ingress. Also, instead of exposing the API, you'll expose the front-end application to the world.
Before you start writing the new configuration files, have a look at how things are going to work behind the scenes.
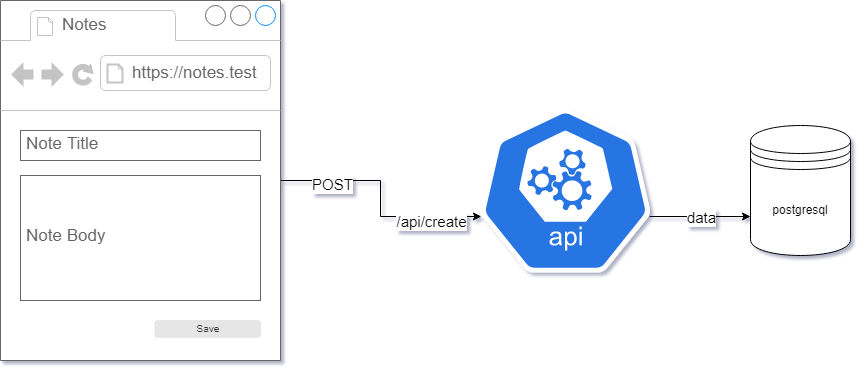 A user visits the front-end application and submits the necessary data. The front-end application then forwards the submitted data to the back-end API.
The API then persists the data in the database and also sends it back to the front-end application. Then routing of the requests is achieved using NGINX.
You can have a look at the nginx/production.conf file to understand how this routing has been set-up.
Now the necessary networking required to make this happen is as follows:
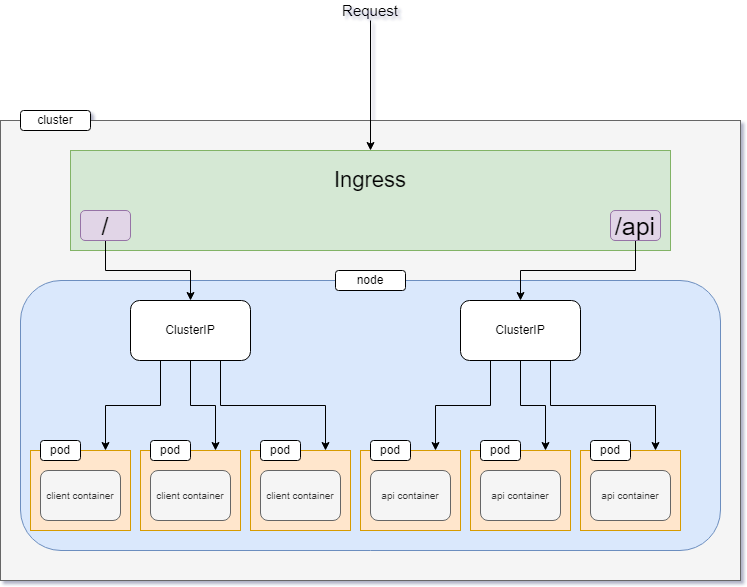 This diagram can be explained as follows:
- The Ingress will act as the entry-point and router for this application. This is an NGINX type Ingress so the port will be the default nginx port which is 80.
- Every request that comes to / will be routed towards the front-end application (the service on the left). So if the URL for this application is https://kube-notes.test, then any request coming to https://kube-notes.test/foo or https://kube-notes.test/bar will be handled by the front-end application.
- Every request that comes to /api will be routed towards the back-end API (the service on the right). So if the URL again is https://kube-notes.test, then any request coming to https://kube-notes.test/api/foo or https://kube-notes.test/api/bar will be handled by the back-end API. It was totally possible to configure the Ingress service to work with sub-domains instead of paths like this, but I chose the path-based approach because that's how my application is designed.
In this sub-section, you'll have to write four new configuration files.
- ClusterIP configuration for the API deployment.
- Deployment configuration for the front-end application.
- ClusterIP configuration for the front-end application.
- Ingress configuration for the routing. I'll go through the first three files very quickly without spending much time explaining them.
The first one is the api-cluster-ip-service.yaml configuration and the contents of the file are as follows:
apiVersion: v1
kind: Service
metadata:
  name: api-cluster-ip-service
spec:
  type: ClusterIP
  selector:
    component: api
  ports:
    - port: 3000
      targetPort: 3000
Although in the previous sub-section you exposed the API directly to the outside world, in this one, you'll let the Ingress do the heavy lifting while exposing the API internally using a good old ClusterIP service.
The configuration itself should be pretty self-explanatory at this point, so I won't be spending any time explaining it.
Next, create a file named client-deployment.yaml responsible for running the front-end application. Contents of the file are as follows:
apiVersion: apps/v1
kind: Deployment
metadata:
  name: client-deployment
spec:
  replicas: 3
  selector:
    matchLabels:
      component: client
  template:
    metadata:
      labels:
        component: client
    spec:
      containers:
        - name: client
          image: fhsinchy/notes-client
          ports:
            - containerPort: 8080
          env:
            - name: VUE_APP_API_URL
              value: /api
It's almost identical to the the api-deployment.yaml file and I'm assuming that you'll be able to interpret this configuration file by yourself.
The VUE_APP_API_URL environment variable here indicates the path to which the API requests should be forwarded. These forwarded requests will be in turn handled by the Ingress.
To expose this client application internally another ClusterIP service is necessary. Create a new file called client-cluster-ip-service.yaml and put the following content in it:
apiVersion: v1
kind: Service
metadata:
  name: client-cluster-ip-service
spec:
  type: ClusterIP
  selector:
    component: client
  ports:
    - port: 8080
      targetPort: 8080
All this does is expose port 8080 within the cluster on which the front end application runs by default.
Now that the boring old configurations are done, the next configuration is the ingress-service.yaml file and the content of the file is as follows:
apiVersion: extensions/v1beta1
kind: Ingress
metadata:
  name: ingress-service
  annotations:
    kubernetes.io/ingress.class: nginx
    nginx.ingress.kubernetes.io/rewrite-target: /$1
spec:
  rules:
    - http:
        paths:
          - path: /?(.*)
            backend:
              serviceName: client-cluster-ip-service
              servicePort: 8080
          - path: /api/?(.*)
            backend:
              serviceName: api-cluster-ip-service
              servicePort: 3000
This configuration file may look quite a bit unfamiliar to you but it's actually pretty straightforward.
- The Ingress API is still in beta phase thus the apiVersion is extensions/v1beta1. Although in beta, the API is very stable and usable in production environments.
- The kind and metadata.name fields serve the same purpose as any of the configurations you wrote earlier.
- metadata.annotations can contain information regarding the Ingress configuration. The kubernetes.io/ingress.class: nginx indicates that the Ingress object should be controlled by the ingress-nginx controller. nginx.ingress.kubernetes.io/rewrite-target indicates that you want to rewrite the URL target in places.
- spec.rules.http.paths contains configuration regarding the individual path routings you previously saw inside the nginx/production.conf file. The paths.path field indicates the path that should be routed. backend.serviceName is the service that the aforementioned path should be routed towards and backend.servicePort is the target port inside that service.
- /?(.) and /api/?(.) are simple regex which means that ?(.*) part will be routed towards the designated services. The way you configure rewrites can change from time to time, so checking out the official docs would be good idea.
Before you apply the new configurations, you'll have to activate the ingress addon for minikube using the addons command. The generic syntax is as follows:
minikube addons <option> <addon name>
To activate the ingress addon, execute the following command:
minikube addons enable ingress

# 🔎 Verifying ingress addon...
# 🌟 The 'ingress' addon is enabled
You can use the disable option for the addon command to disable any addon. You can learn more about the addon command in the official docs.
Once the addon has been activated, you may apply the configuration files. I would suggest deleting all resources (services, deployments, and persistent volume claims) before applying the new ones.
kubectl delete ingress --all

# ingress.extensions "ingress-service" deleted

kubectl delete service --all

# service "api-cluster-ip-service" deleted
# service "client-cluster-ip-service" deleted
# service "kubernetes" deleted
# service "postgres-cluster-ip-service" deleted

kubectl delete deployment --all

# deployment.apps "api-deployment" deleted
# deployment.apps "client-deployment" deleted
# deployment.apps "postgres-deployment" deleted

kubectl delete persistentvolumeclaim --all

# persistentvolumeclaim "database-persistent-volume-claim" deleted

kubectl apply -f k8s

# service/api-cluster-ip-service created
# deployment.apps/api-deployment created
# service/client-cluster-ip-service created
# deployment.apps/client-deployment created
# persistentvolumeclaim/database-persistent-volume-claim created
# ingress.extensions/ingress-service created
# service/postgres-cluster-ip-service created
# deployment.apps/postgres-deployment created
Wait until all the resources have been created. You can utilize the get command to ensure that. Once all of them are running, you can access the application at the IP address of the minikube cluster. To get the IP, you can execute the following command:
minikube ip

# 172.17.0.2
You can also get this IP address by running inspecting the Ingress:
kubectl get ingress

# NAME              CLASS    HOSTS   ADDRESS      PORTS   AGE
# ingress-service   <none>   *       172.17.0.2   80      2m33s
As you can see, the IP and port is visible under the ADDRESS and PORTS columns. By accessing 127.17.0.2:80, you should land directly on the notes application.
 You can perform simple CRUD operations in this application. Port 80 is the default port for NGINX, so you don't need to write the port number in the URL.
You can do a lot with this ingress controller if you know how to configure NGINX. After all, that's what this controller is used for – storing NGINX configurations on a Kubernetes ConfigMap, which you'll be learning about in the next sub-section.
Secrets and Config Maps in Kubernetes
So far in your deployments, you've stored sensitive information such as POSTGRES_PASSWORD in plain text, which is not a very good idea.
To store such values in your cluster you can use a Secret which is a much more secure way of storing passwords, tokens, and so on.
The next step may not work the same in the Windows command line. You can use git bash or cmder for the task.
To store information in a Secret you have to first pass your data through base64. If the plain text password is 63eaQB9wtLqmNBpg then execute following command to get a base64 encoded version:
echo -n "63eaQB9wtLqmNBpg" | base64

# NjNlYVFCOXd0THFtTkJwZw==
This step is not optional, you have to run the plain text string through base64. Now create a file named postgres-secret.yaml inside the k8s directory and put following content in there:
apiVersion: v1
kind: Secret
metadata:
  name: postgres-secret
data:
  password: NjNlYVFCOXd0THFtTkJwZw==
The apiVersion, kind, and metadata fields are pretty self-explanatory. The data field holds the actual secret.
As you can see, I've created a key-value pair where the key is password and the value is NjNlYVFCOXd0THFtTkJwZw==. You'll be using the metadata.name value to identify this Secret in other configuration files and the key to access the password value.
Now to use this secret inside your the database configuration, update the postgres-deployment.yaml file as follows:
apiVersion: apps/v1
kind: Deployment
metadata:
  name: postgres-deployment
spec:
  replicas: 1
  selector:
    matchLabels:
      component: postgres
  template:
    metadata:
      labels:
        component: postgres
    spec:
      volumes:
        - name: postgres-storage
          persistentVolumeClaim:
            claimName: database-persistent-volume-claim
      containers:
        - name: postgres
          image: fhsinchy/notes-postgres
          ports:
            - containerPort: 5432
          volumeMounts:
            - name: postgres-storage
              mountPath: /var/lib/postgresql/data
              subPath: postgres
          env:
          	# not putting the password directly anymore
            - name: POSTGRES_PASSWORD
              valueFrom:
                secretKeyRef:
                  name: postgres-secret
                  key: password
            - name: POSTGRES_DB
              value: notesdb
As you can see, the entire file is the same except the spec.template.spec.continers.env field.
The name environment variable used to store the password value was in plain text before. But now there is a new valueFrom.secretKeyRef field.
The name field here refers to the name of the Secret you created moments ago, and the key value refers to the key from the key-value pair in that Secret configuration file. The encoded value will be decoded to plain text internally by Kubernetes.
Apart from the database configuration, you'll also have to update the api-deployment.yaml file as follows:
apiVersion: apps/v1
kind: Deployment
metadata:
  name: api-deployment
spec:
  replicas: 3
  selector:
    matchLabels:
      component: api
  template:
    metadata:
      labels:
        component: api
    spec:
      containers:
        - name: api
          image: fhsinchy/notes-api
          ports:
            - containerPort: 3000
          env:
            - name: DB_CONNECTION
              value: pg
            - name: DB_HOST
              value: postgres-cluster-ip-service
            - name: DB_PORT
              value: '5432'
            - name: DB_USER
              value: postgres
            - name: DB_DATABASE
              value: notesdb
              # not putting the password directly anymore
            - name: DB_PASSWORD
              valueFrom:
                secretKeyRef:
                  name: postgres-secret
                  key: password
Now apply all these new configurations by executing the following command:
kubectl apply -f k8s

# service/api-cluster-ip-service created
# deployment.apps/api-deployment created
# service/client-cluster-ip-service created
# deployment.apps/client-deployment created
# persistentvolumeclaim/database-persistent-volume-claim created
# secret/postgres-secret created
# ingress.extensions/ingress-service created
# service/postgres-cluster-ip-service created
# deployment.apps/postgres-deployment created
Depending on the state of your cluster, you may see a different set of output.
In case you're having any issue, delete all Kubernetes resources and create them again by applying the configs.
Use the get command to inspect and make sure all the pods are up and running.
Now to test out the new configuration, access the notes application using the minikube IP and try creating new notes. To get the IP, you can execute the following command:
minikube ip

# 172.17.0.2
By accessing 127.17.0.2:80, you should land directly on the notes application.
 There is another way to create secrets without any configuration file. To create the same Secret using kubectl, execute the following command:
kubectl create secret generic postgres-secret --from-literal=password=63eaQB9wtLqmNBpg

# secret/postgres-secret created
This is a more convenient approach as you can skip the whole base64 encoding step. The secret in this case will be encoded automatically.
A ConfigMap is similar to a Secret but is meant to be used with non sensitive information.
To put all the other environment variables in the API deployment inside a ConfigMap, create a new file called api-config-map.yaml inside the k8s directory and put following content in it:
apiVersion: v1
kind: ConfigMap
metadata:
  name: api-config-map
data:
  DB_CONNECTION: pg
  DB_HOST: postgres-cluster-ip-service
  DB_PORT: '5432'
  DB_USER: postgres
  DB_DATABASE: notesdb
apiVersion, kind and metadata are again self-explanatory. The data field can hold the environment variables as key-value pairs.
Unlike the Secret, the keys here have to match the exact key required by the API. Thus, I have sort of copied the variables from api-deployment.yaml file and pasted them here with a slight modification in the syntax.
To make use of this secret in the API deployment, open up the api-deployment.yaml file and update its content as follows:
apiVersion: apps/v1
kind: Deployment
metadata:
  name: api-deployment
spec:
  replicas: 3
  selector:
    matchLabels:
      component: api
  template:
    metadata:
      labels:
        component: api
    spec:
      containers:
        - name: api
          image: fhsinchy/notes-api
          ports:
            - containerPort: 3000
          # not putting environment variables directly
          envFrom:
            - configMapRef:
                name: api-config-map
          env:
            - name: DB_PASSWORD
              valueFrom:
                secretKeyRef:
                  name: postgres-secret
                  key: password
The entire file is almost unchanged except the spec.template.spec.containers.env field.
I have moved the environment variables to the ConfigMap. spec.template.spec.containers.envFrom is used to get data from a ConfigMap. configMapRef.name here indicates the ConfigMap from where the environment variables will be pulled.
Now apply all these new configurations by executing the following command:
kubectl apply -f k8s

# service/api-cluster-ip-service created
# configmap/api-config-map created
# deployment.apps/api-deployment created
# service/client-cluster-ip-service created
# deployment.apps/client-deployment created
# persistentvolumeclaim/database-persistent-volume-claim created
# ingress.extensions/ingress-service configured
# service/postgres-cluster-ip-service created
# deployment.apps/postgres-deployment created
# secret/postgres-secret created
Depending on the state of your cluster, you may see a different set of output.
In case you're having any issue, delete all Kubernetes resources and create them again by applying the configs.
Upon making sure that the pods are up and running using the get command, access the notes application using the minikube IP and try creating new notes.
To get the IP, you can execute the following command:
minikube ip

# 172.17.0.2
By accessing 127.17.0.2:80, you should land directly on the notes application.
 Secret and ConfigMap have a few more tricks up their sleeves that I'm not going to get into right now. But if you're curious, you may check out the official docs.
Performing Update Rollouts in Kubernetes
Now that you've successfully deployed an application consisting of multiple containers on Kubernetes, it's time to learn about performing updates.
As magical as Kubernetes may seem to you, updating a container to a newer image version is a bit of a pain. There are multiple approaches that people often take to update a container, but I am not going to go through all of them.
Instead, I'll jump right into the approach that I mostly take in updating my containers. If you open up the client-deployment.yaml file and look into the spec.template.spec.containers field, you'll find something that looks like this:
containers:
    - name: client
      image: fhsinchy/notes-client
As you can see, in the image field I haven't used any image tag. Now if you think that adding :latest at the end of the image name will ensure that the deployment always pulls the latest available image, you'd be dead wrong.
The approach that I usually take is an imperative one. I've already mentioned in a previous section that, in a few cases, using an imperative approach instead of a declarative one is a good idea. Creating a Secret or updating a container is such a case.
The command you can use to perform the update is the set command, and the generic syntax is as follows:
kubectl set image <resource type>/<resource name> <container name>=<image name with tag>
The resource type is deployment and resource name is client-deployment. The container name can be found under the containers field inside the client-deployment.yaml file, which is client in this case.
I have already build a version of the fhsinchy/notes-client image with a tag of edge that I'll be using to update this deployment.
So the fi
kubectl set image deployment/client-deployment client=fhsinchy/notes-client:edge

# deployment.apps/client-deployment image updated
The update process may take a while, as Kubernetes will recreate all the pods. You can run the get command to know if all the pods are up and running again.
Once they've all been recreated, access the notes application using the minikube IP and try creating new notes. To get the IP, you can execute the following command:
minikube ip

# 172.17.0.2
By accessing 127.17.0.2:80, you should land directly on the notes application.
 Given that I haven't made any actual changes to the application code, everything will remain the same. You can ensure that the pods are using the new image using the describe command.
kubectl describe pod client-deployment-849bc58bcc-gz26b | grep 'Image'

# Image:          fhsinchy/notes-client:edge
# Image ID:       docker-pullable://fhsinchy/notes-client@sha256:58bce38c16376df0f6d1320554a56df772e30a568d251b007506fd3b5eb8d7c2
The grep command is available on Mac and Linux. If you're on Windows, use git bash instead of the windows command line.
Although the imperative update process is a bit tedious, but it can be made much easier by using a good CI/CD workflow.
Combining Configurations
As you've already seen, the number of configuration files in this project is pretty huge despite only having three containers in it.
You can actually combine configuration files as follows:
apiVersion: apps/v1
kind: Deployment
metadata:
  name: client-deployment
spec:
  replicas: 3
  selector:
    matchLabels:
      component: client
  template:
    metadata:
      labels:
        component: client
    spec:
      containers:
        - name: client
          image: fhsinchy/notes-client
          ports:
            - containerPort: 8080
          env:
            - name: VUE_APP_API_URL
              value: /api

---

apiVersion: v1
kind: Service
metadata:
  name: client-cluster-ip-service
spec:
  type: ClusterIP
  selector:
    component: client
  ports:
    - port: 8080
      targetPort: 8080
As you can see, I've combined the contents of the client-deployment.yaml and client-cluster-ip-service.yaml file using a delimiter (---). Although it's possible and can help in projects where the number of containers is very high, I recommend keeping them separate, clean, and concise.
Troubleshooting
In this section, I'll be listing some common issues that you may face during your time with Kubernetes.
- If you're on Windows or Mac and using the Docker driver for minikube, the Ingress plugin will not work.
- If you have Laravel Valet running on Mac and are using the HyperKit driver for minikube, it'll fail to connect to the internet. Turning off the dnsmasq service will resolve the issue.
- If you have a Ryzen (mine is R5 1600) PC and are running Windows 10, the VirtualBox driver may fail to start due to the lack of support for nested virtualization. You'll have to use the Hyper-V driver on Windows 10 (Pro, Enterprise, and Education). For the Home edition users, sadly there is no safe option on that hardware.
- If you're running Windows 10 (Pro, Enterprise, and Education) with the Hyper-V driver for minikube, the VM may fail to start with a message regarding insufficient memory. Don't panic, and execute the minikube start command once again to start the VM properly.
- If you see some of the commands executed in this article missing or misbehaving in the Windows command line, use git bash or cmder instead.
- I would suggest installing a good Linux distribution on your system and using the Docker driver for minikube. This is by far the fastest and most reliable set-up.
Conclusion
I would like to thank you from the bottom of my heart for the time you've spent reading this article. I hope you've enjoyed your time and have learned all the essentials of Kubernetes.
You can follow me on Twitter @frhnhsin or connect with me on on LinkedIn at /in/farhanhasin if you prefer that.
Как разворачивать MongoDB в Kubernetes
Как развернуть и запустить высокодоступный сервис MongoDB в Kubernetes, используя deployments, secret, configMaps и persistent volumes.
MongoDB это проект с открытым исходным кодом, главной целью которого,документо ориентированная распределенная NOSQL база данных, которая в основном популярна на JavaScript проектах. В этой инструкции вы научитесь разворачивать и запускать MongoDB в Kubernetes.
Содержание
- Изучим безопасное использование ключей с помощью Kubernetes secrets.
- Изучим настроку MongoDB используя ConfigMaps.
- Изучим использование Kubernetes Deployment для высокой доступности.
- Изучим хранение данных с помощью Presistent Volume Claims.
- Изучим бэкапирование базы данных используя Kubernetes CronJobs.
MongoDB Docker образ
К сожалению, нет официального образа для MongoDB. Доступно однако образы сообщества Docker. Как с любым неофициальным образом, рекомендую вам просканировать образы на проблемы и проанализировать Dockerfile.
Dockerfile и скрипты сборки MongoDB могут быть найдены в Docker сообществе.
Настройка MongoDB Docker
Скаченый образ предоставляет несколько переменных используемых для настройки базы данных.
MONGO_INITDB_ROOT_USERNAME
MONGO_INITDB_ROOT_PASSWORD
MONGO_INITDB_DATABASE
Первые два используются для логина и пароля администратора сервера. В основном для MongoDB достаточно задать два параметра.
Если MONGO_INITDB_ROOT_USERNAME и MONGO_INITDB_ROOT_PASSWORD не заданы значениями по-умолчанию, любой кто подключается к бд имеет полный доступ.
Secrets
Secrets предоставляет хранилище для безопасного хранения чувствительной информации в Kubernetes. Данные хранятся как секреты зашифрованные в base64, для сокрытия данных когда отображается на экране, и хранится зашифрованно на ETCD базе данных используя Kubernetes.
Два конфигурационных значение которые выдаются как дополнительная защита MONGO_INITDB_ROOT_USERNAME и MONGO_INITDB_ROOT_PASSWORD.
Чтобы создать Kubernetes секрет для MongoDB супер пользователя и пароль, вы должны запустить следующую команду.
kubectl create secret generic mongodb \
--from-literal="root" \
--from-literal='my-super-secret-password'
Как вариант, Secret манифест(secreat.yaml) может быть создать и применен для создания.
Манифест Secret не должен хранится в git, особенно в той же директории где другие манифесты. Kubernetes хранит секреты как base64 зашифрованная строка. Манифест позволяет выбирать написание значения секрета: как обычная строка или base64 зашифрованная строка. Чтобы предотвратить возможность увидеть пароль через ваше плечё есть предложение всегда кодировать пароль в base64.
Для того. чтобы закодировать пароль в строку используюя base64 используйте следющую команду:
echo -n 'my-super-secret-password' | base64
| Output
bXktc3VwZXItc2VjcmV0LXBhc3N3b3Jk
Создайте новый файл с именем mongodb-secrets.yaml и добавьте в него следующеее содеражние. Секреты может быть сохранен в манифесте как data или stringData. Все данные в ключе data должны быть зашифрованны как base64. Значения лежащие в ключе stringData не требуют шифрования base64.
apiVersion: v1
kind: Secret
metadata:
  name: mongodb-secret
data:
  MONGO_INITDB_ROOT_PASSWORD: bXktc3VwZXItc2VjcmV0LXBhc3N3b3Jk
stringData:
  MONGO_INITDB_ROOT_USERNAME: myroot
Применяем манифест чтобы создать ресурс в Kubernetes кластере.
kubectl apply -f mongodb-secrets.yaml
MongoDB Deployment манифест
Deployemnt описывает желаемое состояние которое создаст Deployment Controller. Когда состояние деплойментя отойдет от желаемого, Deployment Controller произведет действия чтобы вернуть желаемое состояние.
Один из примеров управления состоянием это убедится в количестве реплик работающих подов. Если под деплоймента упадет Deployment Controller заменит упавший под.
Обновления и откаты: Когда шаблон пода обновлен в Deployment ресурсе, Deployment Controller разверент обновленные поды прежде чем удалять старые. Новые поды не заменят старые до тех пор, пока не запустятся со здоровым состояниме.
Создадим новый файл mongodb-deployment.yaml и добавим следующее содержание.
apiVersion: app/v1
kind: Deployment
metadata:
  name: mongodb
spec:
  replicas: 1
  selector:
    matchLabels:
      app: mongodb
  template:
    metadata:
      labels:
        app: mongodb
    spec:
      containers:
      - name: mongodb
        image: mongodb:3.6.19-xenial
        ports:
          containerPort: 27017
Пример выше развернет одну реплику MongoDB сущности. Базовый образ использует Docket Community MongoDB v3.6.19 основанные на Ubuntu Xenial.
Применим манифест чтобы создать деплоймент ресуср в Kubernetes.
kubectl apply -f mongodb-deployment.yaml
Свой MongoDB конфиг файл
Наш MongoDB под использует стандартные настройки для вновь созданного сервера. Только 2 параметра сконфигурированны это логин и пароль.
В MongoDB сервере есть множество настроеке. Однако, эти настройки задаются в mongodb.conf файле.
Создаем ConfigMap
Чтобы использовать mongodb.conf файл в нашем экземпляре в Kubernetes вы должны создать файл и сохранить его как configMap сущность.
Возьмем за пример файл mongodb.conf:
systemLog:
   destination: file
   path: "/var/log/mongodb/mongod.log"
   logAppend: true
storage:
   journal:
      enabled: true
processManagement:
   fork: true
net:
   bindIp: 127.0.0.1
   port: 27017
setParameter:
   enableLocalhostAuthBypass: false
Чтобы создать configMap сущность из mongodb.conf файла, запустите Kubernetes команду. Пример ниже создаст configMap с именем mongodb, если он еще не существует, и добавить mongodb.conf в сщуность под названием conf.
kubectl create configMap mongodb-config-file --from-file=conf=mongodb.conf
Монтирование mongodb.conf файла
Самый простой способ использования конфигурационного файла в MongoDB под это монтированием файла в качестве volume. После этого конфигурационный файл будет доступен как файл MongoDB сервиса когда запустится контейнер.
Для монтирования файла в качестве volulme нам нужно обновить наш Deployemtn манифест.
apiVersion: app/v1
kind: Deployment
metadata:
  name: mongodb
spec:
  replicas: 1
  selector:
    matchLabels:
      app: mongodb
  template:
    metadata:
      labels:
        app: mongodb
    spec:
      containers:
      - name: mongodb
        image: mongodb:3.6.19-xenial
        ports:
          containerPort: 27017
        volumeMounts:
        - name: mongodb-configuration-file
          mountPath: /etc/mongod.conf
          readOnly: true
    volumes:
    - name: mongodb-configuration-file
      configMap:
        name: mongodb-config-file
Постоянное хранилище Persistent Volumes
Контейнеры недолговечны по определению. Любое состояние контенейра будет потеряно после перезапуска. Для баз данных как MongoDB, это значит что вся ваша база данных будет стерта.
Persistent Volumes может быть смонтированно в Pod позволяя сохранять данные вне зависимости от наличия контенера. Чтобы добавить Persistent Volumes в контейнер в Kubernetes нужно создать Persistent Volumes Claim и затем смонтировать volume к Deployment.
Создадим файл под названием mongodb-pvc.yaml и добавим в него:
apiVersion: v1
kind: PersistentVolumeClaim
metadata:
  name: mongodb-pv-claim
  labels:
    app: mongodb
spec:
  accessModes:
    - ReadWriteOnce
  resources:
    requests:
      storage: 1Gi
Volume claim создаст хранилие в которое можно будет что-то писать размером в 1GB.
Применим его к нашему Kuberentes кластеру.
kubectl apply -f mongodb-pvc.yaml
Чтобы смонтировать раздел нам нужно обновить наш deployemtn манифест. volume нужно боавить в template ключ нашего манифеста, а volumeMount в ключ контенера, чтобы смонтировать раздел.
apiVersion: apps/v1
kind: Deployment
metadata:
  name: mongodb
spec:
  replicas: 1
  selector:
    matchLabels:
      app: mongodb
  template:
    metadata:
      labels:
        app: mongodb
    spec:
      containers:
      - name: mongodb
        image: mongo:4.4.0-bionic
        ports:
          - containerPort: 27017
        envFrom:
        - secretRef:
            name: mongodb-secret
        volumeMounts:
        - name: mongodb-configuration-file
          mountPath: /etc/mongod.conf
          readOnly: true
        - name: mongodb-persistent-storage
          mountPath: /data/db
      volumes:
      - name: mongodb-persistent-storage
        persistentVolumeClaim:
          claimName: mongodb-pv-claim
      - name: mongodb-configuration-file
        configMap:
          name: mongodb-config-file
Применим новый деплоймент manifest чтобы обновить сущействующee или создать новое развертывание.
kubectl apply -f mongodb-deployment.yaml
Выставление сервисов
Мы развернули один под MongoDB. Выставление пода в виде сервиса настоятельно не рекомендуется вне тестирования или разработки. Поды недолговечны и как только они остановятся их состояние потеряется, в том числе назначенный ip адрес.
Внустренний сервис.
Внутренний сервис это сервис который доступен только внутри кластера Kubernetes. Это стандартное повдение сервиса. Для базы данных сервер и других системы это лучший вариант настройки.
Создадим новый сервис для MongoDB.
apiVersion: v1
kind: Service
metadata:
  name: mongodb
spec:
  selector:
    app: mongodb
  ports:
  - protocol: TCP
    port: 27017
Применим манифест:
kubectl apply -f mongodb-service.yaml
Backing Up MongoDB
Всё что было сказано выше совершенно не содержит шагов отвечающих за безопасность системы. Есть несколько методов для бэкапирования MongoDB в Kubernetes, но эта инструкция сфокусируется на создании расписания в Kubernetes в качествет CronJob.
CronJob
CronJob это расписание контейнеризированных работ.
CronJob бэка для MongoDB будет делать следующее:
- Запустит MongoDB контейнер
- Смонтирует раздел используемый MongoDB
- Выполнит команду
mongodump - Скопирует dump в корзину хранилища, к примеру Google Cloud Storage Bucket.
apiVersion: batch/v1beta1
kind: CronJob
metadata:
  name: mongodb-backup
spec:
  schedule: "*/1 * * * *"
  jobTemplate:
    spec:
      template:
        spec:
          containers:
          - name: mongodb-backup
            image: mongo:4.4.0-bionic
            args:
            - "/bin/sh"
            - "-c"
            - "/usr/bin/mongodump -u $MONGO_INITDB_ROOT_USERNAME -p $MONGO_INITDB_ROOT_PASSWORD -o /tmp/backup -h mongodb"
            - "tar cvzf mongodb-backup.tar.gz /tmp/backup"
            #- gsutil cp mongodb-backup.tar.gz gs://my-project/backups/mongodb-backup.tar.gz
            envFrom:
            - secretRef:
                name: mongodb-secret
            volumeMounts:
            - name: mongodb-persistent-storage
              mountPath: /data/db
          restartPolicy: OnFailure
          volumes:
          - name: mongodb-persistent-storage
            persistentVolumeClaim:
              claimName: mongodb-pv-claim
Упралвение MongoDB in Kubernetes
Так как MongoDB не должно быть доступно вне нашего кластера. Оператор до сих пор может подключиться к нему.
Перенапралвение портов.
Перенаправление портов с помощью kubectl позволяет нам создать проксированное подключение к вашей машине в Kubernetes сервисе. Для MongoDB то значит мы можем создать mongodb подключение к нашему серверу.
kubectl port-forward mongodb-service 27017 &
| Output

Forwarding from 127.0.0.1:27017 -> 27017
Forwarding from [::1]:27017 -> 27017
С помощью полученного порта MongoDB на нашей локальной машине, мы можем использовать mongo клиента для подключения.
mongo -u <root-username> -p <root-password>
| Output

MongoDB shell version v4.2.0
connecting to: mongodb://127.0.0.1:27017/?compressors=disabled&gssapiServiceName=mongodb
Handling connection for 27017
Implicit session: session { "id" : UUID("feb9a859-43eb-4cb3-bdd9-ef76690cbb92") }
MongoDB server version: 3.6.19
WARNING: shell and server versions do not match
Server has startup warnings:
2020-08-24T03:21:23.861+0000 I STORAGE  [initandlisten]
2020-08-24T03:21:23.861+0000 I STORAGE  [initandlisten] ** WARNING: Using the XFS filesystem is strongly recommended with the WiredTiger storage engine
2020-08-24T03:21:23.861+0000 I STORAGE  [initandlisten] **          See http://dochub.mongodb.org/core/prodnotes-filesystem
>
Интерактивная консоль в контейнере
Как замена, можно открыть интерактивную консоль внутри рабочего MongoDB контейнера. Для этого нужно название MongoDB пода чтобы зайти в него.
kubectl get pods
| Output

NAME                       READY   STATUS    RESTARTS   AGE
mongodb-7cfbc6f555-t97c4   1/1     Running   0          12m
Так как у нас только одна реплика и её имя mongodb-7cfbc6f555-t97c4. Теперь зная имя нашего пода можно подключиться к нему.
kubectl exec -it mongodb-7cfbc6f555-t97c4 /bin/bash
| Output

root@mongodb-7cfbc6f555-t97c4:/#
Когда запустится shell в контейнере мы можем управлять MongoDB ипользую его внутренную консоль.
mongo -u $MONGO_INITDB_ROOT_USERNAME -p $MONGO_INITDB_ROOT_PASSWORD
В завершении
В этой инструкции мы обсудили как разворачивать MongoDB в Kubernetes и управлять им. Научились как безопасно хранить данные для доступа к вашей бд. Как настроить сервис для доступности его внутри кластера.
Одна из важных тем это бэкапирование, которую мы развернули в качесте CronJob.
Стратегии развертывания в Kubernetes
В этой статье, мы узнаем, что такое статегии развертывания, во время установки контейнеров используя систему открестрации контейнеров Kubernetes. В конце этой статьи, мы будем знать различные пути установки в кластере Kubernetes.
Обзорное введение в Kubernetes
С популярностью контейнеризации и с револющией в создании, доставке и обслуживании приложений появилась необходимость эффективного обслуживания этих контейнеров. Множество систем оркестраторации контейнеров введены для обслуживания цикла этих контейнеров в больших системах.
Kubernetes один из подобных инструментов оркестрации, который берет на себя заботу о предоставлении и установке, выделении ресурсов, балансировке нагрузки, обнаружении сервисов, предоставлении высокой доступности и другие важные моменты любой системы. С его помощью мы можем разложить наши приложения в на маленькие системы(называемые микросервисами) во время установки. затем мы можем собрать(или оркестрировать) эти системы вместе во время установки.
Применение облачного подхода увеличивает разработку приложений основанных на микросервисной архитектуре. Для таких приложений, наибольший из вызовов это встреча с установкой. Иметь хорошую стратегию - необходимость. В Kubernetes, есть множество путей для выпуска приложений, необходимо выбрать правильную стратегию, чтобы сделать инфраструктуру надежной во время развертывания приложений или обновления. Для примера, в производственной среде, всегда есть требование чтобы пользователи не ощутили время простоя сервиса. В оркестраторе Kubernetes, правильная стратегия - убедиться в верности управления различных версий образов контейнера. В общем, эта статья покрывает различные статегии установки в Kubernetes.
Требования
Чтобы продолжить, нам необходим опыт с кубернетес. Если вы не знакомы с этой платфорой, Пройдите для начала "Step by Step Introduction to Basic Kubernetes Concepts" инструкцию. В ней вы можете найти, всё что нужно для того, чтобы понять, чтоп роисходит в этой иснтрукции. мы также рекомендуем пройти полистать Kubernetes документацию если или когда потребуется.
Кроме того, если нам потребуется kubectl, инструмент командной строки, который позволит нам управлять кластером Kubernetes из терминала. Если у вас нет этого инструмента, проверьт инструкцию по установке kubectl. Так же потребуется базовое понимание Linux и YAML.
Что такое развертывание в Kubernetes?
Развертывание это объект в kubernetes, который определяет желаемое состояние для нашей программы. Развертывание объявляема, это значит, что мы не должны говорить как достигнуть состояния. Вместо этого, мы объявляем желаеме состояние, и позволяем автоматически достигнуть конечного результата наилучшим путём. Развертывание позволяет нам описать жизненный цыкл приложения, к примеру: какой образ использовать для приложения, количество подов, которое необходимо, и способ которым они должны обновляться.
Преимущества использования Kubernetes развертывания.
Процесс ручного обновления контейнеризированных приложенией может занимать много времени и быть скучным. Развертывание Kubernetes делает этот процесс автоматическим и повторяемым. Развертывание полностью управляемое с помощью Kubernetes, и полный процесс производится на стороне сервера без взаимодействия клиента.
Более того, контроллер развертывания Kubernetes всегда мониторит здоровье подов и нод. Он заменяет упавшие поды или пропускает недоступные ноды, убеждаясь в непрерывности критических приложений.
Стратегии развертывания
Последовательное развертывание обновлений
Последовательное развертывание это стандартная развертываемае стратегия для Kubernetes. Он заменяет по одному поды прошлых версий на новые версии, при этом создавая ситуацию в которой не возникает времени простоя. Последовательное развертывание медленно заменяет объекты прошлых верси приложения на новые.
Используя стратегии развертывания, есть две различные возможности, которые позволяют настроить процесс обновления:
Максимальный Всплеск(maxSurge): количество подов, которое может быть создано над желаемым количеством подов во время обновления. Это может быть абсолютное число в процентах от количества реплик. По умолчанию это 25%.
Максимальная недоступность(maxUnavailable): количество подов которое может быть недоступно во время процесса обновления. Это может быть обсолютное количество в процентах от количества реплик, по умолчанию 25%.
Первое мы создадим шаблон нашего последовательного развертывания. В шаблон ниже, мы указали maxSurge = 2 и maxUnavailable = 1.
apiVersion: apps/v1
kind: Deployment
metadata:
  name: rollingupdate-strategy
  version: nanoserver-1709
spec:
  strategy:
    type: RollingUpdate
    rollingUpdate:
      maxSurge: 2
      maxUnavailable: 1
  selector:
    matchLabels:
      app: web-app-rollingupdate-strategy
      version: nanoserver-1709
  replicas: 3
  template:
    metadata:
      labels:
        app: web-app-rollingupdate-strategy
        version: nanoserver-1709
    spec:
      containers:
        - name: web-app-rollingupdate-strategy
          image: hello-world:nanoserver-1709
Мы можем создать развертывание используя kubectl команду.
kubectl apply -f rollingupdate.yaml
Как только мы получили шаблон развертывания, мы можем предоставить путь для доступа объекта развертывания с помощью создания сервиса. Отметим, что мы развертывая образ hello-world с помощью
nanoserver-1709. В этом случае мы имеем два заглавия, name= web-app-rollingupdate-strategy и version=nanoserver-1709. Мы укажем их как названия для сервисов ниже. и сохраним файл service.yml
apiVersion: v1
kind: Service
metadata:
  name: web-app-rollingupdate-strategy
  labels:
    name: web-app-rollingupdate-strategy
    version: nanoserver-1709
spec:
  ports:
    - name: http
      port: 80
      targetPort: 80
  selector:
    name: web-app-rollingupdate-strategy
    version: nanoserver-1709
  type: LoadBalancer
Создание сервиса добавить балансировщик нагрузки который будет доступен снаружи кластера.
$ kubectl apply -f service.yaml
Чтобы проверить наличие деплойментов запускаем команду:
$ kubectl get deployments
Если деплоймент всё еще создается то будет будет следующий ответ:
NAME                             READY   UP-TO-DATE   AVAILABLE   AGE
rollingupdate-strategy   0/3     0            0           1s
Если еще раз запустить команду kubectl get deployments чуть позже. Вывод будет выглядить следующийм образом:
NAME                             READY   UP-TO-DATE   AVAILABLE   AGE
rollingupdate-strategy   3/3     0            0           7s
Чтобы увидеть количество реплик созданых деплойментом, запустите:
$ kubectl get rs
Ответ будет выглядеть следующим образом:
NAME                                    DESIRED   CURRENT   READY   AGE
rollingupdate-strategy-87875f5897   3         3         3       18s
Чтобы увидеть 3 пода запущенных для деплоймента запустите:
$ kubectl get pods
Созданные ReplicaSet(набор реплик)проверять что запущенно 3 рабочих пода. А вывод будет следующим:
NAME                                      READY     STATUS    RESTARTS   AGE
rollingupdate-strategy-87875f5897-55i7o   1/1       Running   0          12s
rollingupdate-strategy-87875f5897-abszs   1/1       Running   0          12s
rollingupdate-strategy-87875f5897-qazrt   1/1       Running   0          12s
Давайте обновим rollingupdate.yaml шаблон деплоймента чтобы использовать образ hello-world:nanoserver-1809 вместо образа hello-world:nanoserver-1709. Затем обновим образ существующего запущенного деплоймента используя команду kubectl.
$ kubectl set image deployment/rollingupdate-strategy web-app-rollingupdate-strategy=hello-world:nanoserver-1809 --record
Вывод будет похожим на:
deployment.apps/rollingupdate-strategy image updated
Теперь мы развертывает образ hello-world с версией nanoserver-1809. В данном случае мы обновили lable в service.yaml. label будет обновлет на version=nanoserver-1809. Еще раз запускаем команду ниже, для обновления сервиса который подберет новый рабочий под, с новой версией образа.
$ kubectl apply -f service.yaml
Чтобы увидеть статус выкатывания запустите команду ниже:
$ kubectl rollout status deployment/rollingupdate-strategy

Waiting for rollout to finish: 2 out of 3 new replicas have been updated...
Запустим еще раз чтобы убедиться что обновление прошло успешно:
$ kubectl rollout status deployment/rollingupdate-strategy

deployment "rollingupdate-strategy" successfully rolled out
После успешного обновления, мы можем посмотреть на деплоймент командой kubectl get deployments:
$ kubectl get deployments

NAME                             READY   UP-TO-DATE   AVAILABLE   AGE
rollingupdate-strategy   3/3     0            0           7s
Выполните kubectl get rs, чтобы увидеть что Deployment обновился. Новые поды созданы в новом ReplicaSet и запущено 3 копии. Старый ReplicaSet больше не содержит рабочих копий.
$ kubectl get rs

NAME                                    DESIRED   CURRENT   READY   AGE
rollingupdate-strategy-87875f5897   3         3         3       55s
rollingupdate-strategy-89999f7895   0         0         0       12s
Запустите kubectl get pods теперь должны быть только новые поды из новой ReplicaSet.
$ kubectl get pods

NAME                                      READY     STATUS    RESTARTS   AGE
rollingupdate-strategy-89999f7895-55i7o   1/1       Running   0          12s
rollingupdate-strategy-89999f7895-abszs   1/1       Running   0          12s
rollingupdate-strategy-89999f7895-qazrt   1/1       Running   0          12s
Очень полезна команда rollout в даннмо случае. Мы можем использовать её чтобы проверить что делает наш deployment. Команда, по-умолчанию, ждет то тех пор пока deplyment не запустит успешно все поды. Когда deployment успешно отработает, команда вернет 0 код в качестве указателя на успех. Если deployment упадет, команда завершиться с ненулевым кодом.
$ kubectl rollout status deployment rollingupdate-strategy

Waiting for deployment "rollingupdate-strategy" rollout to finish: 0 of 3 updated replicas are available…
Waiting for deployment "rollingupdate-strategy" rollout to finish: 1 of 3 updated replicas are available…
Waiting for deployment "rollingupdate-strategy" rollout to finish: 2 of 3 updated replicas are available…

deployment "rollingupdate-strategy" successfully rolled out
Если деплоймент упадет в Kubernetes, процесс deployment остановится, но поды из упавшего deployment остаются. При падении deployment, наше окружение может содержать подыд из двух старых и новых deploymentов. Чтобы вернуться в стабильное, рабочее состояние, мы можем использовать rollout undo команду, чтобы вернуть назад рабочие поды и очистить упавший деплоймент.
$ kubectl rollout undo deployment rollingupdate-strategy

deployment.extensions/rollingupdate-strategy
Затем проверяем статус deployment еще раз.
$ kubectl rollout status deployment rollingupdate-strategy

deployment "rollingupdate-strategy" successfully rolled out
Чтобы указать Kubernetes что приложение готово, нам необходима помощь от приложения. Kubernetes использует проверку готовности для того чтобы знать, что делает приложение. Как только экземпляр начинает отвечать на проверку готовности позитивно, экземпляр считается готовым для использования. Проверка готовности говорит Kubernetes когда приложение готово, но не когда приложение будет всегда готово. Если приложение продалжает падат, оно сможет никогда не ответить позитивно Kubernetes.
Rolling deployment обычно ждет когда новые поды будут готовы через проверку готовности прежде чем опустить старые компоненты. Если возникла существенная проблема, rolling deployment может быть отменен. Если возникает проблема, выкатывание обновлений или развертывания может быть прервано без отключения всего кластера.
Развертывание восстановления
При развертывании восстановления, мы полностью отключаем текущее приложение прежде чем выкатываем новое. На картинке ниже, версия 1 отображает текущую версию приложения, а 2 отражает версию нового приложения. Когда обновление текущей версии приложения, сначала убираем существующие рабочие копии версии 1, затем одновременно развертываем копии с новой версией.
Шаблон ниже показывает развертывание используя стратегию восстановления: Сначала, создаем наш деплоймент и помещаем его в файл recreate.yaml
apiVersion: apps/v1
kind: Deployment
metadata:
  name: recreate-strategy
spec:
  strategy:
    type: Recreate
  selector:
    matchLabels:
      app: web-app-recreate-strategy
      version: nanoserver-1809
  replicas: 3
  template:
    metadata:
      labels:
        app: web-app-recreate-strategy
    spec:
      containers:
        - name: web-app-recreate-strategy
          image: hello-world:nanoserver-1809
Затем мы можем создать развертывание используя команду kubectl
$ kubectl apply -f recreate.yaml
Как только у нас будет шаблон развертывания мы можем предоставить способ для доступа в экземпляры развертывания создавая Service. Отметим, что развертывание образа hello-world с версией nanoserver-1809. В этом случае мы можем иметь два заголовка: name= web-app-recreate-strategy и version=nanoserver-1809. Мы назначим этим загловки для сервиса ниже и сохраним в service.yml.
apiVersion: v1
kind: Service
metadata:
  name: web-app-recreate-strategy
  labels:
    name: web-app-recreate-strategy
    version: nanoserver-1809
spec:
  ports:
    - name: http
      port: 80
      targetPort: 80
  selector:
    name: web-app-recreate-strategy
    version: nanoserver-1809
  type: LoadBalancer
Теперь создание этого сервиса создаст балансировщик нагрузки, который доступен вне кластера.
$ kubectl apply -f service.yaml
Метод создания требует некоторое вермя во время процесса обновления. Время простоя не проблема, если приложение может использовать окно обслуживания или сбой. Однако, если работа приложения критична и имеет высокий уровень SLA и требования доступности, использование различных стратегий развертывания будет правильным применением. Развертывание восстановлния в общем используется для целей разработки, так как легко настраивается и прилоежние полностью обновляется на новую версию. Еще, то что нам не нужно обслуживать больше чем одну версию приложения в паралели, и поэтому мы можем избежать проблем обратной совестимости для данных и приложения.
Blue-Green Развертывание
В blue/green стратегия развертывания(иногда называемая red/black), blue - отражает текущую версию приложения, а green - новую версию приложения. Тут, только 1 версия живет. Траффик марштутизируется в blue развертвание пока green развертывание создается и тестируется. После конца тестирования, направляем траффик на новую версию.
После успешного развертывания, мы можем как сохранить blue развертывание для возможного отката или вывода из эксплуатации. Другая возножность, это развертывание новой версии приложения на этих экземплярах. В этом случае текущая blue окружение обслуживается как подгтотовительное для следующего релиза.
Эта техника может устранить время просто которое мы встретили в развертывании восстановления. Так же, bluegreen развертывание сокращает риск: если что-то необычное случиться с нашей green версией, мы тут же сможем откатиться на прошлую версию просто переключившись на blue версию. Есть постоянная возможность выкатитьоткатиться. Мы так же можем избежать проблем с версией, состояние приложения меняется одним развертыванием.
BlueGreen развертывание очень дорого, так как требует двойные ресурсы. Полноценное тестирование всей платформы должно быть выполнено до релиза его в производствао. Даже больше, обслуживание незименяемого приложения сложно.
Для начала мы создадим наше blue развертывание сохранив blue.yaml file.
apiVersion: apps/v1
kind: Deployment
metadata:
  name: blue-deployment
spec:
  selector:
    matchLabels:
      app: blue-deployment
      version: nanoserver-1709
  replicas: 3
  template:
    metadata:
      labels:
        app: blue-deployment
        version: nanoserver-1709
    spec:
      containers:
        - name: blue-deployment
          image: hello-world:nanoserver-1709
Мы затем создадим развертывание используя kubectl команду
$ kubectl apply -f blue.yaml
Как только у нас есть шаблон развертывания, мы можем предоставить способ к доступу экземпляра развертывания создав сервис. Отметим, что наше развертывание образа hello-world с версией nanoserver-1809. В этом случае у нас есть два загловка name= blue-deployment и version=nanoserver-1709. Мы укажем этим загловки в селекторе сервиса и сохраним в файл service.yaml.
apiVersion: v1
kind: Service
metadata:
  name: blue-green-service
  labels:
    name: blue-deployment
    version: nanoserver-1709
spec:
  ports:
    - name: http
      port: 80
      targetPort: 80
  selector:
    name: blue-deployment
    version: nanoserver-1709
  type: LoadBalancer
Теперь создание сервиса, создаст балансировщик нагрузки который доступен вне кластера.
$ kubectl apply -f service.yaml
Наши настроки готовы.
Для green развертывания мы развернем новое развертывание рядом с blue развертыванием. Шаблон ниже содержит код ниже, сохраним как green.yaml:
apiVersion: apps/v1
kind: Deployment
metadata:
  name: green-deployment
spec:
  selector:
    matchLabels:
      app: green-deployment
      version: nanoserver-1809
  replicas: 3
  template:
    metadata:
      labels:
        app: green-deployment
        version: nanoserver-1809
    spec:
      containers:
        - name: green-deployment
          image: hello-world:nanoserver-1809
Заметим что образ hello-world:nanoserver-1809 изменен. Что значит, что мы сделали отдельное развертывание с двумя загловками, name=green-deployment и version=nanoserver-1809.
$ kubectl apply -f green.yaml
Обрезать green развертывание, мы обновим селектор для существующего сервиса. Изменим service.yaml и заменим селектор версии на вторую и назовем green-deployment. Это будет совпадат с подами green развертывания.
apiVersion: v1
kind: Service
metadata:
  name: blue-green-service
  labels:
    name: green-deployment
    version: nanoserver-1809
spec:
  ports:
    - name: http
      port: 80
      targetPort: 80
  selector:
    name: green-deployment
    version: nanoserver-1809
  type: LoadBalancer
Мы создадим сервис еще раз используя команду kubectl:
$ kubectl apply -f service.yaml
Завершая, можно оценить что bluegreen развертывание есть всё или ничего. В отличии от развертывания выкатывания обновления, где мы не можем постеменно выктить нашу новую версию. Все пользователи получать обновления в одно и то же время, так же существующим версиям будет позволенно завершить их работу в старом экземпляре. Оно так же требует использования больше серверных ресурсов так как нам нужно запустить две копии каждого пода.
К счастью процедура отката проста: Нам просто нужно перевести выключатель обратно, и предыдущая версия будет возвращена. Это потому, что старая версия все еще крутиться на старых подах. Просто трафик не переводится на них. Когда мы убеждаемся что новая версия полноценно работает, мы должны удалить старые поды.
Канареечное развертывание
Стратегия канареечного обновления - частичный процесс который позвляет нам тестировать новые версии программ на реальных пользвоателях без обазтельного полного выкатывания. Похоже на bluegreen развертывания, но более подконтрольно, и они используют более прогрессивную доставку где развертывание применяется пофазово. Есть множество стратегий которые падают под зонтик канареечного развертывания, включая черновой запуск или AB тестирование
В канареечном развертывании новые версии приложения пошагово развертываются в кластер Kubernetes пока не достигнут небольшого количества живого трафика(небольшое количество живых пользователей подключаеются к новой версии пока остаток пользователей всё ещё используют старую версию)ю В этом применении, у нас есть два почти одинаковых сервера: один который используется всем текущим активным пользователям и другой - с новой версией который расчитан на небольшое количество пользователей. Когда становится понятно, что проблем с новой версией нет новая версия пошагово выкатывается на оставшуюся инфраструктуру. В конце, весь живой трафик идет на новую (канареечную) версию и затем становится основной версией производства.
Картинка ниже отражает самый прямой и простой путь произвести канарейчное развертывание. Новая версия развертывает небольшое количество серверов.
Пока это происходит, мы смотрим как обновленные машины работаеют. Мы проверяем ошибки и проблемы производительность, слушаем пользовательские отзывы. С тем как растет увереность в релизе, мы продолжаем устанавливать на оставшихся машинах до тех пор пока они все не обновятся на последний релиз.
Мы должны обратить вниманние на различные вещи когда планируем канареечное развертывание.
- Шаги: Как много пользователей будут переведены на канарейку в начале и как много шагов.
- Длительность: как долго мы планируем запускать канарейку? Канареечный релиз отличаются, так как мы должны дождаться достаточное количество клиентов для обновления, прежде чем мы сможем оценить результаты. Это может происходить в течении нескольких дней и даже недель.
- Метрики: какие местри небходимо записывать для анализа, включая производительность приложения и отчеты ошибок? Хорошо выбранные параметры ведут к успеху канареечного развертывания. Для примера, очень простой способ измерить развертывание с помощью статус кодов HTTP. Мы можем иметь простой ping сервис который возвращает 200 когда развертывание успешно. Он вернет сервер пятисотую ошибку если возникнет проблема с развертыванием.
- Оценка: какие критерии мы будем использовать для определения успешности канареичного релиза.
Канарейка используется в сценарии где мы должны тестировать новый функционал, обычно на бэкенде нашего приложения. Канареечное развертывание должно быть использованно когда мы на 100% не уверенны в новом приложении, мы предсказываем возможные проблемы с маленьким процентом падения. Эта стратегия обычно используется когда у нас идет мажорное обновление, такое, как добавление нового функционала или экспериментального функционала.
Резюме K8s стратегий развертывания
В конце можно сказать, если несколько способов развертывания приложения, когда работаем с devstage окружение, развертывание восстановления или ускоренное, обычно хороший выбор. Когда нужно вылить все на производство, то ускоренное или bluegreen развертывание хороший выбор, но тестирование обазятельно в этом случае. Если мы не уверены в стабильности платформы которая может влиять на выпуск новой версии ПО, тогда канареечный релиз должен быть тем самым путём.
Создание доступа в кубернетес при наличии token и api endpoint
Если у вас есть токен доступа к дашборду кубернетес, а так же вы знаете api адрес кубера, то можете воспользоваться следующим скриптом:
#!/bin/bash
apiendpoint=УКАЖИТЕАДРЕСАПИ
token=УКАЖИТЕТОКЕН

kubectl config set-cluster jelastic --server=$apiendpoint && \
kubectl config set-context jelastic --cluster=jelastic && \
kubectl config set-credentials user --token=$token && \
kubectl config set-context jelastic --user=user && \
kubectl config use-context jelastic
Для проверки работоспосбодности воспользуйтейсь командой:
kubernetes get pods
Настройка безотказного K8s
Независимо от того, пользуетесь ли вы k8s недолго, или вы все еще проверяете его, это говорит, что вы уже имели дело с ним ранее. Но что же такое настройка безотказного k8s кластера?
Что такое события k8s?
Приходилось ли решать проблемы k8s при его использовании? Это может быть довольно сложно, но понимание событий и состояний может сильно помочь. K8s события представляют из себя то, что случается внутри кластера. Событие это тип ресурса создаваемый автоматически, когда происходит изменения состояния кластера. Как вы можете увидеть, событие очень важный ресуср при решении проблем. Прочитайте по поводу state/event управления и таймеров по подробнее, это вам поможет в работе.
Поток управления состоянием
Если вы понимаете что такое поток управления состоянием, легко понять почему некоторые состояния падают, и как можно это предотвратить, давайте капнем глубже:
Kubelet в каждой ноде кластера обновляет API сервевр основываясь на частоте укаазнной в node-status-update-frequence параметре. Значение по умолчанию 10 секунд. Затем, переодически, controller-manager проверяет состояние ноды через API сервер. Частота настроенна в node-monitor-peroid параметре и по умолчанию составляет 5 секунд.
Если controller-manager видит, что нода не здорова в течении node-monitor-grace-period(по-умолчанию 40 секунд), то он помечает её как unhealthy через controller-manager.
Затем controller-manager ожидаает pod-eviction-timeout(по-умолчанию 5 минут) и говорит API серверу убрать поды установив для них состояние terminate.
Kube proxy получает уведомление о удалении ноды от API сервера.
Kube proxy удаляет недоступный под.
Что случается с кластером, когда нода не может этого сделать, основываясь на временных ограничениях. В примере выше, это займент 5 минут и 40 секунд(node-monitor-grace-period + pod-eviction-timeout) для удаления недоступного пода и возвращения в режим готовности. Это не проблема если deployment имеет несколько подов(значение replica больше чем 1) и поды на здоровой ноде могут обрабатывать все запросы без проблем. Если deployment имеет один под или здоровый под не может обрабатывать запросы, тогда 5 минут и 40 секунд это не приемлемое время недоступности сервиса, поэтому лучшее решение настроить переменные в кластере для ускорения реакции на проблемы. Как это сделать, спросите вы? Давайте пройдемся вместе:
Изменения конфигурации для улучшения безотказности кластера.
Решение точно работает для Kubernetes v1.18.3
Сокращаем node-status-update-frequency
node-status-update-frequency - параметр kubelet, он имеет значение по-умолчанию 10 секунд.
Шаги для того, чтотбы заменить значение по-умолчанию
- Изменяем параметр kublet во всех нодах(master и workers) через файл /var/lib/kubelet/kubeadm-flags.env
vi /var/lib/kubelet/kubeadm-flags.env
- Добавляем “--node-status-update-frequency=5s” параметр в конец следующей линии
KUBELET_KUBEADM_ARGS="--cgroup-driver=systemd --network-plugin=cni --pod-infra-container-image=k8s.gcr.io/pause:3.2 --node-status-update-frequency=5s"
-
Сохранаяем файл.
-
Рестартим kubelete.
systemctl restart kubelet
- Повторяем шаги 1-4 на всех нодах.
Сокращаем node-monitor-period и node-monitor-grace-period
node-monitor-period и node-monitor-grace-period настройки controleler-manager b и их значения по-умолчанию 5 секунд и 40 секунд соотвественно.
Шаги для того чтобы их изменить
- Настроим kube-controller-manager в мастер нодах.
vi /etc/kubernetes/manifests/kube-controller-manager.yaml
- Добавим следующие два параметра в kube-controller-manager.yaml файл
- --node-monitor-period=3s
- --node-monitor-grace-period=20s
После добавления двух параметров, конфигурация должна выглядеть примерно так:
spec:
	containers:
	- command:
	- kube-controller-manager
	. . . [There are more parameters here]
	- --use-service-account-credentials=true
	- --node-monitor-period=3s
	- --node-monitor-grace-period=20s
	image: k8s.gcr.io/kube-controller-manager:v1.18.4
	imagePullPolicy: IfNotPresent
...
- Перезапускаем докер
systemctl restart docker
- Повторяем шаги 1-3 на всех мастер нонах
Сокращаем pod-eviction-timeout
pod-eviction-timeout можно сократить установив дополнительный флаг для API сервера.
Шаги для изменения параметра
- Создаем новый файлkubeadm-apiserver-update.yaml в /etc/kubernetes/manifests папки мастер ноды
cd /etc/kubernetes/manifests/
vi kubeadm-apiserver-update.yaml
- Добавляем следующее содержание в kubeadm-apiserver-update.yaml
apiVersion: kubeadm.k8s.io/v1beta2
kind: ClusterConfiguration
	kubernetesVersion: v1.18.3
	apiServer:
	extraArgs:
		enable-admission-plugins: DefaultTolerationSeconds
		default-not-ready-toleration-seconds: "20"
		default-unreachable-toleration-seconds: "20"
Убеждаемся, что kubernetesVersion совпадает с вашей версией Kubernetes
-
Сохраняем
-
Выполняем следующую команду для применения настроек
kubeadm init phase control-plane apiserver --config=kubeadm-apiserver-update.yaml
- Проверяем, что изменения которые были в kube-apiserver.yaml примеенены для
default-not-ready-toleration-secondsиdefault-unreachable-toleration-seconds
cat /etc/kubernetes/manifests/kube-apiserver.yaml
- Повторяем шаги 1-5 для всех мастер нод.
Шаги выше меняеют pod-eviction-timeout для всего кластера, но есть еще один способ изменить pod-eviction-timeout. Это можно сделать добавив tolerations во все deployment, что позволит применить конфиг только на определенныйdeployment. Для такой настройки pod-eviction-timeout, добавьте следующие строки в описание deployment:
tolerations:
	- key: "node.kubernetes.io/unreachable"
	  operator: "Exists"
 	  effect: "NoExecute"
	  tolerationSeconds: 20
	- key: "node.kubernetes.io/not-ready"
	  operator: "Exists"
	  effect: "NoExecute"
	  tolerationSeconds: 20
Если вы работаете с управляемым сервисом Kubernetes, таким как Amazon EKS или AKS, то у вас не будет возможности обновить
pod-eviction-timeoutв кластере. Необходимо использоватьtolerationsдляdeployment.
Вот и всё, вы успешно обработали события K8s.
Стратегии развертывания в Kubernetes
В этой статье, мы узнаем, что такое статегии развертывания, во время установки контейнеров используя систему открестрации контейнеров Kubernetes. В конце этой статьи, мы будем знать различные пути установки в кластере Kubernetes.
Обзорное введение в Kubernetes С популярностью контейнеризации и с револющией в создании, доставке и обслуживании приложений появилась необходимость эффективного обслуживания этих контейнеров. Множество систем оркестраторации контейнеров введены для обслуживания цикла этих контейнеров в больших системах.
Kubernetes один из подобных инструментов оркестрации, который берет на себя заботу о предоставлении и установке, выделении ресурсов, балансировке нагрузки, обнаружении сервисов, предоставлении высокой доступности и другие важные моменты любой системы. С его помощью мы можем разложить наши приложения в на маленькие системы(называемые микросервисами) во время установки. затем мы можем собрать(или оркестрировать) эти системы вместе во время установки.
Применение облачного подхода увеличивает разработку приложений основанных на микросервисной архитектуре. Для таких приложений, наибольший из вызовов это встреча с установкой. Иметь хорошую стратегию - необходимость. В Kubernetes, есть множество путей для выпуска приложений, необходимо выбрать правильную стратегию, чтобы сделать инфраструктуру надежной во время развертывания приложений или обновления. Для примера, в производственной среде, всегда есть требование чтобы пользователи не ощутили время простоя сервиса. В оркестраторе Kubernetes, правильная стратегия - убедиться в верности управления различных версий образов контейнера. В общем, эта статья покрывает различные статегии установки в Kubernetes.
Требования
Чтобы продолжить, нам необходим опыт с кубернетес. Если вы не знакомы с этой платфорой, Пройдите для начала "Step by Step Introduction to Basic Kubernetes Concepts" инструкцию. В ней вы можете найти, всё что нужно для того, чтобы понять, чтоп роисходит в этой иснтрукции. мы также рекомендуем пройти полистать Kubernetes документацию если или когда потребуется.
Кроме того, если нам потребуется kubectl, инструмент командной строки, который позволит нам управлять кластером Kubernetes из терминала. Если у вас нет этого инструмента, проверьт инструкцию по установке kubectl. Так же потребуется базовое понимание Linux и YAML.
Что такое развертывание в Kubernetes?
Развертывание это объект в kubernetes, который определяет желаемое состояние для нашей программы. Развертывание объявляема, это значит, что мы не должны говорить как достигнуть состояния. Вместо этого, мы объявляем желаеме состояние, и позволяем автоматически достигнуть конечного результата наилучшим путём. Развертывание позволяет нам описать жизненный цыкл приложения, к примеру: какой образ использовать для приложения, количество подов, которое необходимо, и способ которым они должны обновляться.
Преимущества использования Kubernetes развертывания.
Процесс ручного обновления контейнеризированных приложенией может занимать много времени и быть скучным. Развертывание Kubernetes делает этот процесс автоматическим и повторяемым. Развертывание полностью управляемое с помощью Kubernetes, и полный процесс производится на стороне сервера без взаимодействия клиента.
Более того, контроллер развертывания Kubernetes всегда мониторит здоровье подов и нод. Он заменяет упавшие поды или пропускает недоступные ноды, убеждаясь в непрерывности критических приложений.
Стратегии развертывания
Последовательное развертывание обновлений
Последовательное развертывание это стандартная развертываемае стратегия для Kubernetes. Он заменяет по одному поды прошлых версий на новые версии, при этом создавая ситуацию в которой не возникает времени простоя. Последовательное развертывание медленно заменяет объекты прошлых верси приложения на новые.
Используя стратегии развертывания, есть две различные возможности, которые позволяют настроить процесс обновления:
Максимальный Всплеск(maxSurge): количество подов, которое может быть создано над желаемым количеством подов во время обновления. Это может быть абсолютное число в процентах от количества реплик. По умолчанию это 25%.
Максимальная недоступность(maxUnavailable): количество подов которое может быть недоступно во время процесса обновления. Это может быть обсолютное количество в процентах от количества реплик, по умолчанию 25%.
Первое мы создадим шаблон нашего последовательного развертывания. В шаблон ниже, мы указали maxSurge = 2 и maxUnavailable = 1.
apiVersion: apps/v1
kind: Deployment
metadata:
  name: rollingupdate-strategy
  version: nanoserver-1709
spec:
  strategy:
    type: RollingUpdate
    rollingUpdate:
      maxSurge: 2
      maxUnavailable: 1
  selector:
    matchLabels:
      app: web-app-rollingupdate-strategy
      version: nanoserver-1709
  replicas: 3
  template:
    metadata:
      labels:
        app: web-app-rollingupdate-strategy
        version: nanoserver-1709
    spec:
      containers:
        - name: web-app-rollingupdate-strategy
          image: hello-world:nanoserver-1709
Мы можем создать развертывание используя kubectl команду.
kubectl apply -f rollingupdate.yaml
Как только мы получили шаблон развертывания, мы можем предоставить путь для доступа объекта развертывания с помощью создания сервиса. Отметим, что мы развертывая образ hello-world с помощью
nanoserver-1709. В этом случае мы имеем два заглавия, name= web-app-rollingupdate-strategy и version=nanoserver-1709. Мы укажем их как названия для сервисов ниже. и сохраним файл service.yml
apiVersion: v1
kind: Service
metadata:
  name: web-app-rollingupdate-strategy
  labels:
    name: web-app-rollingupdate-strategy
    version: nanoserver-1709
spec:
  ports:
    - name: http
      port: 80
      targetPort: 80
  selector:
    name: web-app-rollingupdate-strategy
    version: nanoserver-1709
  type: LoadBalancer
Создание сервиса добавить балансировщик нагрузки который будет доступен снаружи кластера.
$ kubectl apply -f service.yaml
Чтобы проверить наличие деплойментов запускаем команду:
$ kubectl get deployments
Если деплоймент всё еще создается то будет будет следующий ответ:
NAME                             READY   UP-TO-DATE   AVAILABLE   AGE
rollingupdate-strategy   0/3     0            0           1s
Если еще раз запустить команду kubectl get deployments чуть позже. Вывод будет выглядить следующийм образом:
NAME                             READY   UP-TO-DATE   AVAILABLE   AGE
rollingupdate-strategy   3/3     0            0           7s
Чтобы увидеть количество реплик созданых деплойментом, запустите:
$ kubectl get rs
Ответ будет выглядеть следующим образом:
NAME                                    DESIRED   CURRENT   READY   AGE
rollingupdate-strategy-87875f5897   3         3         3       18s
Чтобы увидеть 3 пода запущенных для деплоймента запустите:
$ kubectl get pods
Созданные ReplicaSet(набор реплик)проверять что запущенно 3 рабочих пода. А вывод будет следующим:
NAME                                      READY     STATUS    RESTARTS   AGE
rollingupdate-strategy-87875f5897-55i7o   1/1       Running   0          12s
rollingupdate-strategy-87875f5897-abszs   1/1       Running   0          12s
rollingupdate-strategy-87875f5897-qazrt   1/1       Running   0          12s
Давайте обновим rollingupdate.yaml шаблон деплоймента чтобы использовать образ hello-world:nanoserver-1809 вместо образа hello-world:nanoserver-1709. Затем обновим образ существующего запущенного деплоймента используя команду kubectl.
$ kubectl set image deployment/rollingupdate-strategy web-app-rollingupdate-strategy=hello-world:nanoserver-1809 --record
Вывод будет похожим на:
deployment.apps/rollingupdate-strategy image updated
Теперь мы развертывает образ hello-world с версией nanoserver-1809. В данном случае мы обновили lable в service.yaml. label будет обновлет на version=nanoserver-1809. Еще раз запускаем команду ниже, для обновления сервиса который подберет новый рабочий под, с новой версией образа.
$ kubectl apply -f service.yaml
Чтобы увидеть статус выкатывания запустите команду ниже:
$ kubectl rollout status deployment/rollingupdate-strategy

Waiting for rollout to finish: 2 out of 3 new replicas have been updated...
Запустим еще раз чтобы убедиться что обновление прошло успешно:
$ kubectl rollout status deployment/rollingupdate-strategy

deployment "rollingupdate-strategy" successfully rolled out
После успешного обновления, мы можем посмотреть на деплоймент командой kubectl get deployments:
$ kubectl get deployments

NAME                             READY   UP-TO-DATE   AVAILABLE   AGE
rollingupdate-strategy   3/3     0            0           7s
Выполните kubectl get rs, чтобы увидеть что Deployment обновился. Новые поды созданы в новом ReplicaSet и запущено 3 копии. Старый ReplicaSet больше не содержит рабочих копий.
$ kubectl get rs

NAME                                    DESIRED   CURRENT   READY   AGE
rollingupdate-strategy-87875f5897   3         3         3       55s
rollingupdate-strategy-89999f7895   0         0         0       12s
Запустите kubectl get pods теперь должны быть только новые поды из новой ReplicaSet.
$ kubectl get pods

NAME                                      READY     STATUS    RESTARTS   AGE
rollingupdate-strategy-89999f7895-55i7o   1/1       Running   0          12s
rollingupdate-strategy-89999f7895-abszs   1/1       Running   0          12s
rollingupdate-strategy-89999f7895-qazrt   1/1       Running   0          12s
Очень полезна команда rollout в даннмо случае. Мы можем использовать её чтобы проверить что делает наш deployment. Команда, по-умолчанию, ждет то тех пор пока deplyment не запустит успешно все поды. Когда deployment успешно отработает, команда вернет 0 код в качестве указателя на успех. Если deployment упадет, команда завершиться с ненулевым кодом.
$ kubectl rollout status deployment rollingupdate-strategy

Waiting for deployment "rollingupdate-strategy" rollout to finish: 0 of 3 updated replicas are available…
Waiting for deployment "rollingupdate-strategy" rollout to finish: 1 of 3 updated replicas are available…
Waiting for deployment "rollingupdate-strategy" rollout to finish: 2 of 3 updated replicas are available…

deployment "rollingupdate-strategy" successfully rolled out
Если деплоймент упадет в Kubernetes, процесс deployment остановится, но поды из упавшего deployment остаются. При падении deployment, наше окружение может содержать подыд из двух старых и новых deploymentов. Чтобы вернуться в стабильное, рабочее состояние, мы можем использовать rollout undo команду, чтобы вернуть назад рабочие поды и очистить упавший деплоймент.
$ kubectl rollout undo deployment rollingupdate-strategy

deployment.extensions/rollingupdate-strategy
Затем проверяем статус deployment еще раз.
$ kubectl rollout status deployment rollingupdate-strategy

deployment "rollingupdate-strategy" successfully rolled out
Чтобы указать Kubernetes что приложение готово, нам необходима помощь от приложения. Kubernetes использует проверку готовности для того чтобы знать, что делает приложение. Как только экземпляр начинает отвечать на проверку готовности позитивно, экземпляр считается готовым для использования. Проверка готовности говорит Kubernetes когда приложение готово, но не когда приложение будет всегда готово. Если приложение продалжает падат, оно сможет никогда не ответить позитивно Kubernetes.
Rolling deployment обычно ждет когда новые поды будут готовы через проверку готовности прежде чем опустить старые компоненты. Если возникла существенная проблема, rolling deployment может быть отменен. Если возникает проблема, выкатывание обновлений или развертывания может быть прервано без отключения всего кластера.
Развертывание восстановления
При развертывании восстановления, мы полностью отключаем текущее приложение прежде чем выкатываем новое. На картинке ниже, версия 1 отображает текущую версию приложения, а 2 отражает версию нового приложения. Когда обновление текущей версии приложения, сначала убираем существующие рабочие копии версии 1, затем одновременно развертываем копии с новой версией.
Шаблон ниже показывает развертывание используя стратегию восстановления: Сначала, создаем наш деплоймент и помещаем его в файл recreate.yaml
apiVersion: apps/v1
kind: Deployment
metadata:
  name: recreate-strategy
spec:
  strategy:
    type: Recreate
  selector:
    matchLabels:
      app: web-app-recreate-strategy
      version: nanoserver-1809
  replicas: 3
  template:
    metadata:
      labels:
        app: web-app-recreate-strategy
    spec:
      containers:
        - name: web-app-recreate-strategy
          image: hello-world:nanoserver-1809
Затем мы можем создать развертывание используя команду kubectl
$ kubectl apply -f recreate.yaml
Как только у нас будет шаблон развертывания мы можем предоставить способ для доступа в экземпляры развертывания создавая Service. Отметим, что развертывание образа hello-world с версией nanoserver-1809. В этом случае мы можем иметь два заголовка: name= web-app-recreate-strategy и version=nanoserver-1809. Мы назначим этим загловки для сервиса ниже и сохраним в service.yml.
apiVersion: v1
kind: Service
metadata:
  name: web-app-recreate-strategy
  labels:
    name: web-app-recreate-strategy
    version: nanoserver-1809
spec:
  ports:
    - name: http
      port: 80
      targetPort: 80
  selector:
    name: web-app-recreate-strategy
    version: nanoserver-1809
  type: LoadBalancer
Теперь создание этого сервиса создаст балансировщик нагрузки, который доступен вне кластера.
$ kubectl apply -f service.yaml
Метод создания требует некоторое вермя во время процесса обновления. Время простоя не проблема, если приложение может использовать окно обслуживания или сбой. Однако, если работа приложения критична и имеет высокий уровень SLA и требования доступности, использование различных стратегий развертывания будет правильным применением. Развертывание восстановлния в общем используется для целей разработки, так как легко настраивается и прилоежние полностью обновляется на новую версию. Еще, то что нам не нужно обслуживать больше чем одну версию приложения в паралели, и поэтому мы можем избежать проблем обратной совестимости для данных и приложения.
Blue-Green Развертывание
В blue/green стратегия развертывания(иногда называемая red/black), blue - отражает текущую версию приложения, а green - новую версию приложения. Тут, только 1 версия живет. Траффик марштутизируется в blue развертвание пока green развертывание создается и тестируется. После конца тестирования, направляем траффик на новую версию.
После успешного развертывания, мы можем как сохранить blue развертывание для возможного отката или вывода из эксплуатации. Другая возножность, это развертывание новой версии приложения на этих экземплярах. В этом случае текущая blue окружение обслуживается как подгтотовительное для следующего релиза.
Эта техника может устранить время просто которое мы встретили в развертывании восстановления. Так же, blue\green развертывание сокращает риск: если что-то необычное случиться с нашей green версией, мы тут же сможем откатиться на прошлую версию просто переключившись на blue версию. Есть постоянная возможность выкатить\откатиться. Мы так же можем избежать проблем с версией, состояние приложения меняется одним развертыванием.
Blue\Green развертывание очень дорого, так как требует двойные ресурсы. Полноценное тестирование всей платформы должно быть выполнено до релиза его в производствао. Даже больше, обслуживание незименяемого приложения сложно.
Для начала мы создадим наше blue развертывание сохранив blue.yaml file.
apiVersion: apps/v1
kind: Deployment
metadata:
  name: blue-deployment
spec:
  selector:
    matchLabels:
      app: blue-deployment
      version: nanoserver-1709
  replicas: 3
  template:
    metadata:
      labels:
        app: blue-deployment
        version: nanoserver-1709
    spec:
      containers:
        - name: blue-deployment
          image: hello-world:nanoserver-1709
Мы затем создадим развертывание используя kubectl команду
$ kubectl apply -f blue.yaml
Как только у нас есть шаблон развертывания, мы можем предоставить способ к доступу экземпляра развертывания создав сервис. Отметим, что наше развертывание образа hello-world с версией nanoserver-1809. В этом случае у нас есть два загловка name= blue-deployment и version=nanoserver-1709. Мы укажем этим загловки в селекторе сервиса и сохраним в файл service.yaml.
apiVersion: v1
kind: Service
metadata:
  name: blue-green-service
  labels:
    name: blue-deployment
    version: nanoserver-1709
spec:
  ports:
    - name: http
      port: 80
      targetPort: 80
  selector:
    name: blue-deployment
    version: nanoserver-1709
  type: LoadBalancer
Теперь создание сервиса, создаст балансировщик нагрузки который доступен вне кластера.
$ kubectl apply -f service.yaml
Наши настроки готовы.
Для green развертывания мы развернем новое развертывание рядом с blue развертыванием. Шаблон ниже содержит код ниже, сохраним как green.yaml:
apiVersion: apps/v1
kind: Deployment
metadata:
  name: green-deployment
spec:
  selector:
    matchLabels:
      app: green-deployment
      version: nanoserver-1809
  replicas: 3
  template:
    metadata:
      labels:
        app: green-deployment
        version: nanoserver-1809
    spec:
      containers:
        - name: green-deployment
          image: hello-world:nanoserver-1809
Заметим что образ hello-world:nanoserver-1809 изменен. Что значит, что мы сделали отдельное развертывание с двумя загловками, name=green-deployment и version=nanoserver-1809.
$ kubectl apply -f green.yaml
Обрезать green развертывание, мы обновим селектор для существующего сервиса. Изменим service.yaml и заменим селектор версии на вторую и назовем green-deployment. Это будет совпадат с подами green развертывания.
apiVersion: v1
kind: Service
metadata:
  name: blue-green-service
  labels:
    name: green-deployment
    version: nanoserver-1809
spec:
  ports:
    - name: http
      port: 80
      targetPort: 80
  selector:
    name: green-deployment
    version: nanoserver-1809
  type: LoadBalancer
Мы создадим сервис еще раз используя команду kubectl:
$ kubectl apply -f service.yaml
Завершая, можно оценить что blue\green развертывание есть всё или ничего. В отличии от развертывания выкатывания обновления, где мы не можем постеменно выктить нашу новую версию. Все пользователи получать обновления в одно и то же время, так же существующим версиям будет позволенно завершить их работу в старом экземпляре. Оно так же требует использования больше серверных ресурсов так как нам нужно запустить две копии каждого пода.
К счастью процедура отката проста: Нам просто нужно перевести выключатель обратно, и предыдущая версия будет возвращена. Это потому, что старая версия все еще крутиться на старых подах. Просто трафик не переводится на них. Когда мы убеждаемся что новая версия полноценно работает, мы должны удалить старые поды.
Канареечное развертывание
Стратегия канареечного обновления - частичный процесс который позвляет нам тестировать новые версии программ на реальных пользвоателях без обазтельного полного выкатывания. Похоже на blue\green развертывания, но более подконтрольно, и они используют более прогрессивную доставку где развертывание применяется пофазово. Есть множество стратегий которые падают под зонтик канареечного развертывания, включая черновой запуск или A\B тестирование
В канареечном развертывании новые версии приложения пошагово развертываются в кластер Kubernetes пока не достигнут небольшого количества живого трафика(небольшое количество живых пользователей подключаеются к новой версии пока остаток пользователей всё ещё используют старую версию)ю В этом применении, у нас есть два почти одинаковых сервера: один который используется всем текущим активным пользователям и другой - с новой версией который расчитан на небольшое количество пользователей. Когда становится понятно, что проблем с новой версией нет новая версия пошагово выкатывается на оставшуюся инфраструктуру. В конце, весь живой трафик идет на новую (канареечную) версию и затем становится основной версией производства.
Картинка ниже отражает самый прямой и простой путь произвести канарейчное развертывание. Новая версия развертывает небольшое количество серверов.
Пока это происходит, мы смотрим как обновленные машины работаеют. Мы проверяем ошибки и проблемы производительность, слушаем пользовательские отзывы. С тем как растет увереность в релизе, мы продолжаем устанавливать на оставшихся машинах до тех пор пока они все не обновятся на последний релиз.
Мы должны обратить вниманние на различные вещи когда планируем канареечное развертывание.
- Шаги: Как много пользователей будут переведены на канарейку в начале и как много шагов.
- Длительность: как долго мы планируем запускать канарейку? Канареечный релиз отличаются, так как мы должны дождаться достаточное количество клиентов для обновления, прежде чем мы сможем оценить результаты. Это может происходить в течении нескольких дней и даже недель.
- Метрики: какие местри небходимо записывать для анализа, включая производительность приложения и отчеты ошибок? Хорошо выбранные параметры ведут к успеху канареечного развертывания. Для примера, очень простой способ измерить развертывание с помощью статус кодов HTTP. Мы можем иметь простой ping сервис который возвращает 200 когда развертывание успешно. Он вернет сервер пятисотую ошибку если возникнет проблема с развертыванием.
- Оценка: какие критерии мы будем использовать для определения успешности канареичного релиза. Канарейка используется в сценарии где мы должны тестировать новый функционал, обычно на бэкенде нашего приложения. Канареечное развертывание должно быть использованно когда мы на 100% не уверенны в новом приложении, мы предсказываем возможные проблемы с маленьким процентом падения. Эта стратегия обычно используется когда у нас идет мажорное обновление, такое, как добавление нового функционала или экспериментального функционала.
Резюме K8s стратегий развертывания
В конце можно сказать, если несколько способов развертывания приложения, когда работаем с dev\stage окружение, развертывание восстановления или ускоренное, обычно хороший выбор. Когда нужно вылить все на производство, то ускоренное или blue\green развертывание хороший выбор, но тестирование обазятельно в этом случае. Если мы не уверены в стабильности платформы которая может влиять на выпуск новой версии ПО, тогда канареечный релиз должен быть тем самым путём.
Cluster Autoscaler: как он работает и решение частых проблем
Что такое Cluster Autosc
Kubernetes представляет несколько механизмов для масштабирования нагрузки. Три главные механизмы это : VPA, HPA, CA.
CA автоматически подбирает количество нод в кластере под требования. Когда число подов, которые находятся в очереди назначения или при остутствии возможности назначить, показывает что ресурсов не хватает в кластере, CA добавляет новые ноды в кластер. Он так же может уменьшить количество нод если они не до конца используются долгое время.
Обычно Cluster Autoscaler устанавливается как объект Deployment в кластере. Он работает только одной репликой и использует выборный механизм для того. чтобы быть уверенным, что он полностью доступен.
Как работает Cluster Autoscaler
Для простоты, мы объясним процесс Cluster Autoscaler в режиме масштабирования. Когда число назначенных подов в кластере увеличивается, указывая на недостаток ресурсов, CA автоматически запускает новые ноды.
Это проявляется в четырех шагах:
- CA проверяет назначенные поды, время проверки 10 секунд(для настройки можно указать флаг
--scan-interval) - Если есть назначенные поды, CA запускаем новые ноды для масштабирования кластера, в рамках конфигурации кластера. CA встраивается в облачную платформу, например AWS или Azure, используя их возможности масштабирования для того, чтобы можно было управлять vm.
- K8s регистрирует новые vm в качестве нод, позволяя K8s запускать поды на свежих ресурсах.
- K8s планировщик запускает назначенные поды на новые ноды. ew nodes.
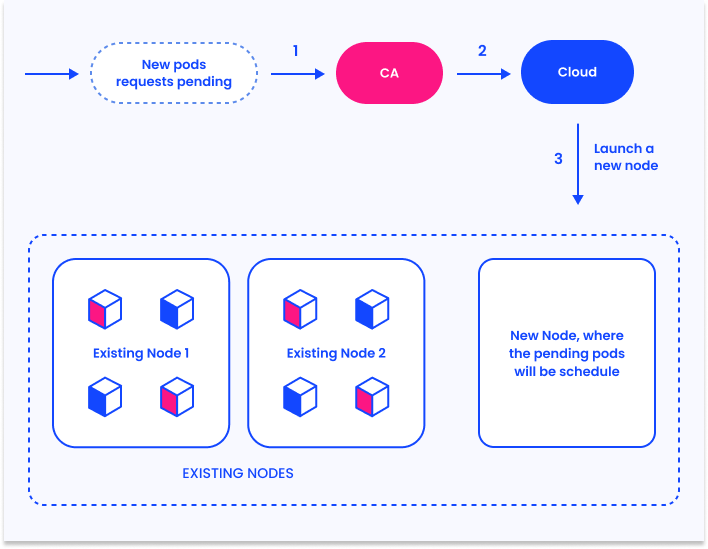
Обнаружение проблем с Cluster Autoscaler
CA полезный механизм, но он может работать не так, как ожидает администратор. Вот первшые шаги, чтобы найти проблему с CA.
Логирование на нодах
План управления K8s создает логи активности CA по следующему пути: /var/log/cluster-autoscaler.log
События
kube-system/cluster-autoscaler-status ConfigMap производят следующие события:
- ScaledUpGroup - это событие говорит, CA увеличивает размер группы нод(предоставляется прошлый и текущий размеры)
- ScaleDownEmpty - это событие означение, что CA убирает ноду, которая не имеет подов(системные поды при этом не рассматриваюца)
- ScaleDown - это событие создается, когда CA убирает ноду, которая имеет запущенные поды. Событие содержит имена всех подов, которые будет перезазначены на другие ноды в результате действия.
События нод
- TriggeredScaleUp - это cобытие говорит, что CA увеличивает кластер, так как появились поды в очереди.
- NotTriggerScaleUp - событие говорит, что CA не может увеличить количество нод в группе.
- ScaleDown - это событие значит, что CA пробует перенести поды с ноды, чтобы затем освободить ноду и удалить из кластера.
Cluster Autoscaler: работа с определенными ошибками
Предлагаем несколько определенных ситуаций, которые могут повяится при работе CA и возможные решения этих проблем.
Эта инструкция позволит выяснить простые ошибки работы CA, но для более сложных проблем, включающие множество двигающихся частей в кластере, возможно придется автоматизировать инструментарий решения проблем.
Ноды с недостаточной нагрузой не удалются из кластера.
Вот причины по которы CA не может уменьшить количество нод, и что можно с этим сделать.
| Причина проблемы | Что можно сделать |
|---|---|
| В описании пода есть указание, что его нельзя перенести на другую ноду. | Проверьте отсутсвующий ConfigMap и создайте его, или используйте другой. |
| Группа нод уже имеет минимальное значение. | Сократите минимальное значение в настройках CA. |
| Нода имеет директиву “scale-down disabled”. | Уберите директиву с ноды. |
CA ожидает времени согласно одному из указанных следующих флагов: --scale-down-unneeded-time --scale-down-delay-after-add, --scale-down-delay-after-failure, --scale-down-delay-after-delete, --scan-interval |
Сократите время указанное во соответсвующем флаге, или дождись указанного времени. |
| Неудачна япопытка удаления ноды(CA будет ждать 5 минут пееред повторной попыткой) | Подождите 5 минут и проверьте решилась ли проблема. . |
Поды в состоянии penind, но новые ноды не создаются.
Ниже приведены причины почему CA может не увеличивать количество нод в кластере, и что с этим можно сделать.
| Причина | Что можно сделать |
|---|---|
| Создаваемый под имеет запросы превыщающие характеристики ноды. | Дать возможность CA добавлять большие ноды, или сократить требования ресурсов для пода. |
| Все подходящие группы нод имеют максимально разрешенное значение. | Увеличьте максимальное значение необходимой группы. |
| Новый под не назначается но новые ноды. | Изменити описание пода, чтобы предоставить возможность поду назначаться на определенной группе нод. |
NoVolumeZoneConflict error— показывает, что StatefulSet требует запуск в той же зоне что и PersistentVolume(PV), но эта зона уже имеет доступный лимит .| начиная с Kubernetes 1.13, вы можете разделить группу нод на зоны и использовать флаг --balance-similar-node-groups для балансировки.|
Cluster Autoscaler прекратил работать
Если CA не работает, пройдитесь по следующим шагам, чтобы понять проблему.
- Проверьте что CA запущен. Это можно проверить по последнему событию, которое генерируется в
kube-system/cluster-autoscaler-statusConfigMap. Оно не должно превышать 3 минуты. - Проверьте если кластер и группы нод находятся в здоровом состоянии, это так же можно найти в configMap
- Проверьте наличие неготовых нод - если какие-то ноды оказываются
unreadyпроверьте число resoureceUnready. Если какие-то ноды помечены, проблема, скорей всего, в том, что не было установленно необходимое ПО. - Если состояние CA и кластера здоровое, проверьте:
- Control plane CA logs - могут указать на проблему, которая может не давать масштабировать кластер.
- CA события для pod объекта — может дать понимание почему CA не переназначает поды.
- Cloud provider resources quota— если есть неудачные попытки добавить ноду, проблема может быть в квотах ресурсов у провайдера.
- Networking issues— если провайдер пытается создать ноду, но она не подключается к кластеру, это может говорить о проблеме с сетью.
K8s: Deployments против StatefulSets против DaemonSets
Kubernetes (K8s) is an open-source container orchestration system for automating deployment, scaling, and management of containerized applications. Kubernetes provides a basic resource called Pod. A pod is the smallest deployable unit in Kubernetes which is actually a wrapper around containers. A pod can have one or more containers and you can pass different configuration to the container(s) using the pod’s configuration e.g. passing environment variables, mounting volumes, having health checks, etc. For more details about pods, check Pod. In this post, I will be discussing three different ways to deploy your application(pods) on Kubernetes using different Kubernetes resources. Below are 3 different resources that Kubernetes provides for deploying pods. Deployments StatefulSets DaemonSets There is one other type ReplicationController but Kubernetes now favors Deployments as Deployments configure ReplicaSets to support replication. For detailed differences between the 3 resources, I will be deploying a sample counter app, which logs and increments the count from a counter file like 1,2,3,…. I am using the counter file from a Persistent Volume to detail the differences between the Deployments, StatefulSets and DaemonSets. The manifests files to deploy the following resources can be found in the counter app. Deployments Deployment is the easiest and most used resource for deploying your application. It is a Kubernetes controller that matches the current state of your cluster to the desired state mentioned in the Deployment manifest. e.g. If you create a deployment with 1 replica, it will check that the desired state of ReplicaSet is 1 and current state is 0, so it will create a ReplicaSet, which will further create the pod. If you create a deployment with name counter, it will create a ReplicaSet with name counter-, which will further create a Pod with name counter--. Deployments are usually used for stateless applications. However, you can save the state of deployment by attaching a Persistent Volume to it and make it stateful, but all the pods of a deployment will be sharing the same Volume and data across all of them will be same. For deploying the sample counter app using a deployment, we will be using the following manifest, you can deploy it by copying the below manifest and saving it in a file e.g. deployment.yaml, and then applying by kubectl apply -f deployment.yaml
If you deploy the above deployment, and see the logs of the pod, you will be able to see the log in order like 1,2,3,…
The logs from the 1st pod, Note the name of pod, counter-c9d778cf7-jd9bw, counter — deployment name, c9d778cf7 — ReplicaSet id, jd9b2 — Pod id Persistence in Deployments Now if you scale the deployment to 2 by running kubectl scale deployment counter --replicas=2 you can see a new pod created, if you check the logs of the new pod, its logs will not start from 1 rather it will start from the last number of the 1st pod.
The logs from the 2nd pod, Note the name of pod, counter-c9d778cf7-jd9bw. Deployment and replicaset id are same only pod id is different than previous pod. If you see the logs, they are starting from 73, meaning that the previous pod had written till 72 in the file and they both are sharing the same file and volume and data is shared across all pods of a Deployment. Also if you check the Persistent Volume Claims(PVCs), only one PVC will be created that both the pods will be sharing so it can cause Data Inconsistency. Persistence for replicas in Deployments Persistence for Deployments sharing single Volume can cause Data Inconsistency Deployments, as discussed, creates a ReplicaSet which then creates a Pod so whenever you update the deployment using RollingUpdate(default) strategy, a new ReplicaSet is created and the Deployment moves the Pods from the old ReplicaSet to the new one at a controlled rate. Rolling Update means that the previous ReplicaSet doesn’t scale to 0 unless the new ReplicaSet is up & running ensuring 100% uptime. If an error occurs while updating, the new ReplicaSet will never be in Ready state, so old ReplicaSet will not terminate again ensuring 100% uptime in case of a failed update. In Deployments, you can also manually roll back to a previous ReplicaSet, if needed in case if your new feature is not working as expected. StatefulSets StatefulSet(stable-GA in k8s v1.9) is a Kubernetes resource used to manage stateful applications. It manages the deployment and scaling of a set of Pods, and provides guarantee about the ordering and uniqueness of these Pods. StatefulSet is also a Controller but unlike Deployments, it doesn’t create ReplicaSet rather itself creates the Pod with a unique naming convention. e.g. If you create a StatefulSet with name counter, it will create a pod with name counter-0, and for multiple replicas of a statefulset, their names will increment like counter-0, counter-1, counter-2, etc Every replica of a stateful set will have its own state, and each of the pods will be creating its own PVC(Persistent Volume Claim). So a statefulset with 3 replicas will create 3 pods, each having its own Volume, so total 3 PVCs. For deploying the sample counter app using a statefulset, we will be using the following manifest. you can deploy it by copying the below manifest and saving it in a file e.g. statefulset.yaml, and then applying by kubectl apply -f statefulset.yaml
If you deploy the above statefulset, and see the logs of the pod, you will be able to see the log in order like 1,2,3,…
The logs from the 1st pod. Note the name of the pod is counter-0 Here, you can see the logs start from 1. Now if we scale up the statefulset to 3 replicas by run kubectl scale statefulsets counter --replicas=3 it will first create a new pod counter-1, and once that pod is ready, then another pod counter-2. The new pods will have their own Volume and if you check the logs, the count will again start from 1 for the new pods, unlike in Deployments as we saw earlier.
The logs from 2nd pod. Note the name is counter-1. Here, the logs are again starting from 1, as this pod has its own Volume, so it doesn’t read the file of 1st pod. And if we see the Persistent Volume Claims,their will be 3 claims created as we had scaled the replicas to 3.
PVC
Persistence for StatefulSets each having its own Volume StatefulSets don’t create ReplicaSet or anything of that sort, so you cant rollback a StatefulSet to a previous version. You can only delete or scale up/down the Statefulset. If you update a StatefulSet, it also performs RollingUpdate i.e. one replica pod will go down and the updated pod will come up, then the next replica pod will go down in same manner e.g. If I change the image of the above StatefulSet, the counter-2 will terminate and once it terminates completely, then counter-2 will be recreated and counter-1 will be terminated at the same time, similarly for next replica i.e. counter-0. If an error occurs while updating, so only counter-2 will be down, counter-1 & counter-0 will still be up, running on previous stable version. Unlike Deployments, you cannot roll back to any previous version of a StatefulSet. StatefulSets are useful in case of Databases especially when we need Highly Available Databases in production as we create a cluster of Database replicas with one being the primary replica and others being the secondary replicas. The primary will be responsible for read/write operations and secondary for read only operations and they will be syncing data with the primary one.
Using StatefulSets to provision Postgres as Highly Available Database If the primary goes down, any of the secondary replica will become primary and the StatefulSet controller will create a new replica in account of the one that went down, which will now become a secondary replica.
In case if postgres-0 went down, now postgres-1 became the primary replica DaemonSet A DaemonSet is a controller that ensures that the pod runs on all the nodes of the cluster. If a node is added/removed from a cluster, DaemonSet automatically adds/deletes the pod. Some typical use cases of a DaemonSet is to run cluster level applications like: Monitoring Exporters: You would want to monitor all the nodes of your cluster so you will need to run a monitor on all the nodes of the cluster like NodeExporter. Logs Collection Daemon: You would want to export logs from all nodes so you would need a DaemonSet of log collector like Fluentd to export logs from all your nodes. However, Daemonset automatically doesn’t run on nodes which have a taint e.g. Master. You will have to specify the tolerations for it on the pod. Taints are a way of telling the nodes to repel the pods i.e. no pods will be schedule on this node unless the pod tolerates the node with the same toleration. The master node is already tainted by:
Which means it will repel all pods that do not tolerate this taint, so for daemonset to run on all nodes, you would have to add following tolerations on DaemonSet
which means that it should tolerate all nodes. For deploying the sample counter app using a daemonset, we will be using the following manifest. you can deploy it by copying the below manifest and saving it in a file e.g. daemonset.yaml, and then applying by kubectl apply -f daemonset.yaml
When you deploy the daemonset, it will create pods equal to the number of nodes. In terms of behavior, it will behave the same as Deployments i.e. all pods will share the same Persistent Volume.
Logs of a pod of DaemonSet These are the logs of a pod of DaemonSet, you can see the logs are not in order, meaning that all pods are sharing the same Volume. Also only one PVC will be created that all pods will be sharing.
Similar to ReplicaSet, but DaemonSets run one replica per node in the cluster If you update a DaemonSet, it also performs RollingUpdate i.e. one pod will go down and the updated pod will come up, then the next replica pod will go down in same manner e.g. If I change the image of the above DaemonSet, one pod will go down, and when it comes back up with the updated image, only then the next pod will terminate and so on. If an error occurs while updating, so only one pod will be down, all other pods will still be up, running on previous stable version. Unlike Deployments, you cannot roll back your DaemonSet to a previous version. That’s all, these are the main resources to deploy your applications (containers) on Kubernetes.
Postgres connection pool для Kubernetes
Проблема
Если вы разрабатываете приложения используя такой фреймворк как Django или RoR, вы, скорей всего, сталкивались со следуюущей проблемой:
FATAL: sorry, too many clients already
Как вы знаете, этот тип фрейморка использует пул подключений к базе данных, с целью сократить время работы с базой данных.
Это всегда здорово когда ваша бд настроениа обслуживать множество подключений.
Как вы можете понять, это не случай с Postgres.
Каждое подключение postgres использует порядка 10mb, так же большую часть времени они находятся в ожидании.
Вместе с бумом gRPC потоков, всё стало хуже. У нас есть кучество подключений в ожидании, но Postgres запрашивает больше ресурсов ни на что, чтобы перевести подключения в состояние ожидания.
PgBouncer на помощь
Есть несколько решений для проблем с множественными подключениями но все из них используют один и тот же шаблон, прокси по середине.
Идея такова, вы подключаете потребителя к прокси, который позволяет множество дешовых подключений, и этот прокси подключает к Postgres базе даных только когда ваше приложение действительно необходимо произвести действие в дб.
Одно из этих решений - PgBouncer.
Это старейшее решение и оно широко используется.
Pgbouncer в вашем кластере K8S
Запустить pgbouncer в кластер проще паренной репы.
Мы будем использовать этот образ: edoburu/pgbouncer
Для начала определим configmap, указав следующие настройки для подключения к Postgres дб:
- DB_HOST: адрес Postgres дб
- DB_USER: Postgres пользоатель
- DB_PASSWORD: Postgres пользователь базы данных (его необходимо хранить в закрытом виде).
- POOL_MODE: указываем параметр в режиме "transaction", так как нужно подключаться к Postgres дб, когда нам реально это нужно.
- SERVER_RESET_QUERY: прошлые подключения могут быть использованы другими клиентами. Очень важно скдиывать предыдущие сессии.
DISCARD ALLиспользуется для версий Postgres 8.3<
pgbouncer-configmap.yaml
apiVersion: v1

kind: ConfigMap
metadata:
  name: pgbouncer-env
  namespace: test

data:
  DB_HOST:
  DB_PASSWORD:
  DB_USER:
  POOL_MODE: transaction
  SERVER_RESET_QUERY: DISCARD ALL
Настройки деплоймента должны выглядеть следующим образом:
#pgbouncer-deployment.yaml
apiVersion: apps/v1
kind: Deployment
metadata:
  name: pgbouncer-deployment
  namespace: test
  labels:
    app: pgbouncer-app
spec:
  selector:
    matchLabels:
      app: pgbouncer-app
  template:
    metadata:
      labels:
        app: pgbouncer-app
    spec:
      containers:
        -  image: edoburu/pgbouncer:1.9.0
           name: pgbouncer-pod
           ports:
           - containerPort: 5432
             name: pgbouncer-p
           securityContext:
             allowPrivilegeEscalation: false
             capabilities:
               drop:
               - all
           lifecycle:
             preStop:
               exec:
                 command:
                 - /bin/sh
                 - -c
                 - killall -INT pgbouncer && sleep 120
           envFrom:
           - configMapRef:
               name: pgbouncer-env
Мы примеяем конфи используя стандартную команду(не забываем сначала создать configmap, а затем деплоймент):
$ kubectl apply -f pgbouncer-configmap.yaml
$ kubectl apply -f pgbouncer-deployment.yaml
Осталось только создать сервис для протребителя.
#pgbouncer-service.yaml
apiVersion: v1
kind: Service
metadata:
  name: pgbouncer-service
  namespace: test
spec:
  type: ClusterIP
  selector:
    app: pgbouncer-app
  ports:
  - name: pgbouncer
    port: 5432
    targetPort: pgbouncer-p
Применяем конфиг сервиса:
$ kubectl apply -f pgbouncer-service.yaml
Вот и всё!
Можно пользоваться, только не забудьте изменить DB_HOST переменную в вашем деплойменте с postgres адреса на pgbouncer-service(в нашем случае)
Kubernetes Rolling Update Configuration
Deployment controllers are a type of Pod controller in Kubernetes. They provide fine-grained control over how its pods are configured, how updates are performed, how many pods should run, and when pods should be terminated. There are many resources available for how to configure basic deployments, but it can be difficult to understand how each option impacts how rolling updates are performed. In this blog post we will cover the following topics to prepare you to become an expert with Kubernetes deployments:
Kubernetes Deployment Overview
Kubernetes deployments are essentially just a wrapper around ReplicaSets. The ReplicaSet manages the number of running pods, and the Deployment implements features on top of that to allow rolling updates, health checks on pods, and easy roll-back of updates.
During normal operations, the Deployment will just manage a single ReplicaSet which ensures that desired number of pods are running:
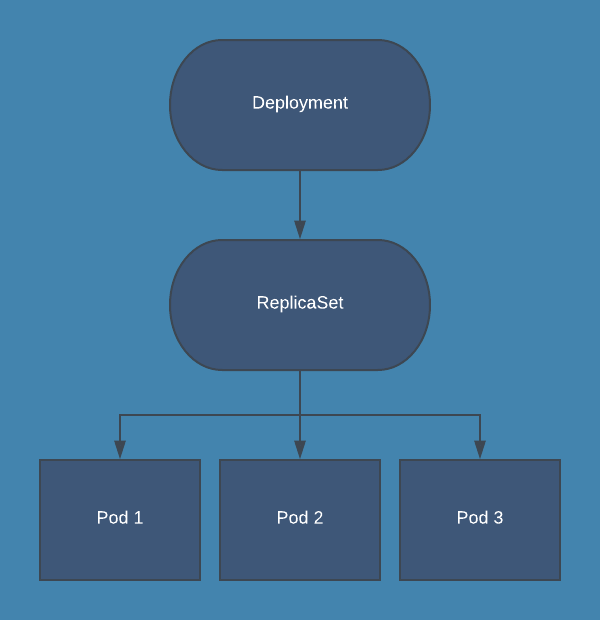
When using Deployments, you should not directly manage the ReplicaSet that is created by the Deployment. All operations that you would perform on a ReplicaSet should be performed on the Deployment instead, which then manages the process for updating the ReplicaSet. Here are some example kubectl commands for commonly performed operations on a Deployment:
# List deployments:
kubectl get deploy

# Update a deployment with a manifest file:
kubectl apply -f test.yaml

# Scale a deployment “test” to 3 replicas:
kubectl scale deploy/test --replicas=3

# Watch update status for deployment “test”:
kubectl rollout status deploy/test

# Pause deployment on “test”:
kubectl rollout pause deploy/test

# Resume deployment on “test”:
kubectl rollout resume deploy/test

# View rollout history on “test”:
kubectl rollout history deploy/test

# Undo most recent update on “test”:
kubectl rollout undo deploy/test

# Rollback to specific revision on “test”:
kubectl rollout undo deploy/test --to-revision=1
Kubernetes Rolling Updates
One of the primary benefits of using a Deployment to control your pods is the ability to perform rolling updates. Rolling updates allow you to update the configuration of your pods gradually, and Deployments offer many options to control this process.
The most important option to configure rolling updates is the update strategy. In your Deployment manifest, spec.strategy.type has two possible values:
- RollingUpdate: New pods are added gradually, and old pods are terminated gradually
- Recreate: All old pods are terminated before any new pods are added In most cases, RollingUpdate is the preferable update strategy for Deployments. Recreate can be useful if you are running a pod as a singleton, and having a duplicate pod for even a few seconds is not acceptable.
When using the RollingUpdate strategy, there are two more options that let you fine-tune the update process:
-
maxSurge: The number of pods that can be created above the desired amount of pods during an update
-
maxUnavailable: The number of pods that can be unavailable during the update process Both maxSurge and maxUnavailable can be specified as either an integer (e.g. 2) or a percentage (e.g. 50%), and they cannot both be zero. When specified as an integer, it represents the actual number of pods; when specifying a percentage, that percentage of the desired number of pods is used, rounded down. For example, If you were using the default values of 25% for both maxSurge and maxUnavailable, and applied an update to a Deployment with 8 pods, then maxSurge would be 2 pods, and maxUnavailable would also be 2 pods. That means that during the update process, the following conditions will be met:
-
At most 10 pods (8 desired pods + 2 maxSurge pods) will be Ready during the update
-
At least 6 pods (8 desired pods - 2 maxUnavailable pods) will always be Ready during the update It is important to note that when considering the number of pods a Deployment should run during an update, it will be using the number of replicas specified in the updated version of the deployment, not the existing version.
Another way of understanding these options is: maxSurge is the maximum number of new pods that will be created at a time, and maxUnavailable is the maximum number of old pods that will be deleted at a time. Let’s step through the process for updating a Deployment with 3 replicas from “v1” to “v2” using the following update strategy:
replicas: 3
strategy:
    type: RollingUpdate
    rollingUpdate:
      maxSurge: 1
      maxUnavailable: 0
This strategy says that we want to add pods one at a time, and that there must always be 3 pods ready in the deployment. The following gif will illustrate what happens in every step of the rolling update. Pods are marked as Ready if the Deployment sees them as fully deployed, NotReady if they are being created, and Terminating if they are being removed.
Kubernetes Rolling Update Configuration
Ready Pods in Kubernetes
Deployments implement the concept of ready pods to aide rolling updates. Readiness probes allow the deployment to gradually update pods while giving you the control to determine when the rolling update can proceed; it is also used by Services to determine which pods should be included in a service’s endpoints. Readiness probes are similar to, but not the same as liveness probes. Liveness probes allow the kubelet to determine which pods need to be restarted according to their Restart Policy, and they are configured separate from readiness probes. They do not impact the update process for Deployments.
A Ready pod is one that is considered successfully updated by the Deployment and will no longer count towards the surge count for deployment. A pod will be considered ready if its readiness probe is successful and spec.minReadySeconds have passed since the pod was created. The default for these options will result in a pod that is ready as soon as its containers start.
Here are several reasons why you would not want a pod to be ready as soon as the containers start:
- You want a health check endpoint to pass before serving traffic
- The application needs to warm up before serving traffic
- You want to slow down the deploy to reduce the impact on the running system Requiring a passing health check is very common for web applications, and is essential to performing updates with minimal disruption. Here is an example readiness probe for a web application to perform a health check:
readinessProbe:
          periodSeconds: 15
          timeoutSeconds: 2
          successThreshold: 2
          failureThreshold: 2
          httpGet:
            path: /health
            port: 80
This probe requires that calls to /health on port 80 succeed within 2 seconds, are performed every 15 seconds, and that 2 successful calls are required before the pod is ready. This means that in the best case scenario, the pod would be ready in ~30 seconds. Many applications will not be able to immediately service even simple requests within 2 seconds upon startup, so you should be prepared for the first 1 or 2 checks to fail, resulting in an actual ready time of ~60 seconds.
You can also configure a readiness probe that executes a command on the container. This allows you to write custom scripts that can be executed and determine if a pod is ready and the deployment can continue updating:
readinessProbe:
          exec:
            command:
              - /startup.sh
          initialDelaySeconds: 5
          periodSeconds: 15
          successThreshold: 1
In this configuration, the Deployment will wait 5 seconds and then execute the command every 15 seconds. An exit code of 0 is considered successful. The flexibility of using a command allows you to do things like load data into a cache or warmup the JVM, or do health checks on downstream services without modifying application code.
The last scenario we will cover here is slowing down the update process on purpose to minimize the impact on your system. While this may not seem like something you need at first glance, it can be very useful in several situations. This includes event processing systems, monitoring tools, and pods that have a long warmup time. This goal is easily accomplished by specifying minReadySeconds in your deployment spec. When minReadySeconds is specified, a pod must run for that many seconds without any of its containers crashing to be considered ready by the deployment.
For example, say you had a deployment running 5 pods that read from an event stream, process events, and save them to a database. It takes each pod about 60 seconds to warm up and process events at full speed. In the default configuration, the pods would be replaced and immediately become ready, but they would be slow to process events for the first minute. Immediately after your update is finished, this event processing system will have fallen behind and will need to catch up since all of the pods had to warm up at the same time. Instead, you can set your maxSurge to 1, maxUnavailable to 0, and minReadySeconds to 60. This would ensure new pods would be created one at a time, a minute would pass between pods being added, and old pods would only be removed once new pods have already warmed up. This way you update all your pods over the course of ~5 minutes, and your processing times remain stable.
Kubernetes Pod Affinity and Anti-Affinity
Affinity and anti-affinity allow you to control on which nodes the pods in your deployment can be scheduled. While this feature is not specific to deployments, it can be very useful for many applications.
When configuring affinity or anti-affinity, you will have to choose how you want your preferences to apply to new pods in different circumstances. There are two options:
- requiredDuringSchedulingIgnoredDuringExecution: the pod cannot be scheduled on a node unless it matches the affinity configuration, even if there are no nodes that match
- preferredDuringSchedulingIgnoredDuringExecution: the scheduler will attempt to schedule the pod on a node matching the affinity configuration, but if it is unable to do so the pod will still be scheduled on another node Pod affinity is used to schedule pods onto certain nodes. You would normally want to do this if you know that a pod has a specific resource requirement that can be met by a specific set of nodes e.g. nodes with a GPU, a node in a certain zone, or if you want the pods co-located with other pods that they will interact with e.g. running a web server on the same node as a cache to avoid making calls across the network. Here is an example of an affinity configuration in the pod spec of a deployment for running co-located pods:
affinity:
    podAffinity:
      requiredDuringSchedulingIgnoredDuringExecution:
      - labelSelector:
          matchExpressions:
          - key: app
            operator: In
            values:
            - cache
        topologyKey: "kubernetes.io/hostname"
Pod anti-affinity is useful for ensuring that pods in a Deployment are not scheduled all on one node, on nodes that have specialized resources needed elsewhere, or co-located with other pods. Here is an example anti-affinity configuration that prefers pods in the app “web” to not be scheduled on nodes that already have “web” pods, so that it is more likely that a single node is not running the entire deployment by itself.
podAntiAffinity:
      preferredDuringSchedulingIgnoredDuringExecution:
      - weight: 100
        podAffinityTerm:
          labelSelector:
            matchExpressions:
            - key: app
              operator: In
              values:
              - web
          topologyKey: kubernetes.io/hostname
The important thing to realize when configuring affinity and anti-affinity, is that the affinity rules are evaluated as pods are scheduled, and the scheduler is not able to foresee where pods will be scheduled. This means that in reality, affinity rules may not have the effect you desire. Consider a cluster with 3 nodes, and a deployment with 3 pods using the above anti-affinity configuration and a rollout config with a maxSurge of 1. Your goal may be to run one pod per node, but the scheduler can only try and schedule one pod at a time during the rollout. This means that over time, you will likely end up with nodes that do not have any of these pods after one update, and then all or most of the pods will move to that node on the following update. The scheduler does not know that you are going to terminate the old pods and still considers them in the anti-affinity scheduling. If you do have a goal to specifically run exactly one copy of a pod on each node, you should use DaemonSets. Another option, if your application can tolerate it, is to change your update strategy to Recreate. This way, when the scheduler evaluates your affinity rules no old pods will be running.
Affinity and anti-affinity have a plethora of options that can influence how pods are scheduled, but there are generally no guarantees when doing a rolling update. It is a very useful feature in certain circumstances, but unless you really need to control where pods run, you should defer to the kubernetes scheduler to make these decisions. The full Kubernetes documentation for pod affinity and anti-affinity can be found here.
Conclusion
We’ve gone over the basic usage of deployments, how rolling updates work, and many configuration options for fine-tuning updates and pod scheduling. At this point you should be able to confidently create and modify your deployments using update strategy, readiness probes, and pod affinity to get the desired state for your application. For a detailed reference on all of the options supported by deployments, check out the Kubernetes documentation.
If you are interested in a fully-managed solution to monitoring Kubernetes deployments and other resources, check out Blue Matador. Blue Matador automatically does event detection and classification for dozens of Kubernetes events and metrics, all with very little set up on your part. We also have Linux, Windows, and AWS integrations to meet all of your monitoring needs.
Basics of autoscaling nodes and pods in Kubernetes
Hosting Kubernetes with a provider like Google Cloud Platform or Amazon Web services offloads a lot of management for Kubernetes administrators. One of the major benefits of hosted Kubernetes is automatic scalability, which almost all cloud platforms offer. In this blog post, we will cover the basics of configuring an auto scaling node pool in Google Kubernetes Engine. First, let’s get a basic understanding of the services involved.
Scaling Nodes
Vocabulary:
- Node - A single compute instance in Kubernetes. Think of it as the actual machine that everything is running on, whether it be a bare metal or virtual server.
- Node Pool - A collection of one or more nodes together. In Google Kubernetes Engine (GKE), instead of provisioning multiple virtual machines and assigning them to a node pool, you can just create an instance group (known as an autoscaling group in AWS) and set that as your node pool. Instance groups will automatically provision and deprovision virtual machines based on resource usage. This allows for a lot of flexibility with Kubernetes since pods are highly scalable as well. Deciding on the size of the nodes within the node pool takes a little more effort.
Scaling Pods
Vocabulary:
- Pod - A collection of one or more containers running together. Think of this as one level above a container, a collection of containers that has all the information needed to run on any platform.
- Horizontal Pod Autoscaler (HPA) - An API in Kubernetes that defines how and when a pod creates more replicas.
- Resources - Virtual computing resources such as CPU or memory.
- Pod Resource Utilization - The percentage of resources being used out of what is available on the pod.
Pods are at the heart of Kubernetes. The same way that a node is the smallest compute instance, a pod is the smallest process instance. Pods are made up of one or more containers and instructions on how to run those containers. All of that together creates a pod which is a fully functioning micro service. Kubernetes uses pods because they are very mobile and can be deployed on top of any node as long as there are resources available.
Before digging into scaling pods, it is helpful to understand how nodes and pods interact. Pods run your app’s containers on top of your nodes. Both nodes and pods have memory limits. The interplay in memory limits will tell Kubernetes how many pods can be run on a single node. For example, if your nodes are machines with 10GB memory, and your pods have memory limits of 5GB, Kubernetes will run two pods on each node. If your pods have 2.5GB limits, a single node will run four pods, etc.
In this post we will be setting up autoscaling for pods based on some thresholds. Because we have instance groups (or AWS autoscaling groups) set up that scale nodes on resource usage, when more pods are added, Kubernetes will implicitly scale nodes along with the pods. For example, with 10GB nodes and 5GB pods, if you scale to three pods, Kubernetes will run two nodes. Scale to four pods, Kubernetes will still run two nodes; when you have five pods, kubernetes will spin up an additional node to handle the fifth pod.
Kubernetes has a built-in method for scaling pods called the horizontal pod autoscaler (HPA). The HPA will increase the number of pods based on certain metrics defined by the administrator in the HPA manifest file. The most widely used metrics to scale by are CPU and memory average utilization. This is measured by taking the mean utilization of all pods running the service. In the manifest below, you can see we have set our HPA to increase the number of pods if our average CPU utilization is above 60%.
apiVersion: autoscaling/v2beta2
kind: HorizontalPodAutoscaler
metadata:
  name: nginx-hpa
spec:
  scaleTargetRef:
    apiVersion: apps/v1
    kind: Deployment
    name: nginx-deployment
  minReplicas: 4
  maxReplicas: 10
  metrics:
    - type: Resource
      resource:
        name: cpu
        target:
          type: Utilization
          averageUtilization: 60
Note: Kubernetes does have a Vertical Pod Autoscaler which scales over a long period of time, adjusting the resource requests and limits based on a set of metrics. This is a separate topic to be discussed and is not covered in this post.
Resource Requests and Limits
Vocabulary:
- Resource Requests - The guaranteed resources given to a pod. If there is no node with the resources to meet the resource request, the pod is not deployed until a new node is available.
- Resource Limit - The maximum resources a pod can use before being throttled or restarted. If the CPU is being used beyond the limit, it will get throttled down. However, passing the limit for memory and any other resources will trigger a restart of the pod.
- Realistic Load - The high point of traffic you can expect on a regular basis, such as a weekly high point.
- Breaking Point Load - An extreme load that may or may not ever happen, but will lead to the service crashing. Resource requests and limits are used to prevent pods from hoarding all the resources of a node. Since the resource request defines what a pod is expected to have at startup, a pod cannot be deployed to a node that does not have that many resources available. Resource requests are also used by the metrics service to calculate the resource utilization as we mentioned earlier. Resource requests and limits are defined in the deployment manifest and set at the container level as seen below.
apiVersion: apps/v1
kind: Deployment
metadata:
  name: nginx-deployment
spec:
  selector:
    matchLabels:
      app: nginx
  replicas: 1
  template:
    metadata:
      labels:
        app: nginx
    spec:
      containers:
      - name: nginx
        image: nginx:1.7.9
        ports:
        - name: http
          containerPort: 80
        resources:
          requests:
            memory: 6Gi # This pod will not be deployed unless a node has 6GB of memory available
            cpu: 1
          limits:
            memory: 9Gi # If this pod exceeds using 9GB of memory, it will restart
            cpu: 1.5
Now that the basics are covered, let’s start by baselining our service. In GKE, you can view usage metrics at several levels, including the node level, the service level (all the pods running the same application), and the pod level. In order to baseline our service, we will dig into pod level metrics. If you are also using GCP, you can go to the dashboard, and then open up Kubernetes Engine > Workloads > select the name of the service you are trying to baseline > select any pod from this list.
For this example, let’s just focus on memory. Looking at this pod over the past four days, it would seem that we are greatly over allocating memory. We use less than 0.5GB of memory, but have a requested 6GB! Although this seems like a mistake, it’s important to remember that we allocate resources for our service under load, not at baseline. This is because pods take time to spin up, and even though that process is only seconds, it is still enough time for pods to crash and throw errors.
Let’s now run a load test and see the memory consumption under a realistic load. The test you use here can be a custom script or using a tool like K6 or JMeter. We have a custom script that we use which we can define the number of parallel requests coming through. Keep your monitoring tool open so you can see the resources needed to handle this increased load.
These metrics make it clear that our application uses around 5.5GB of memory under load. This is the situation we want to allocate resources for. In the case of a heavy spike in traffic, we want to be sure that our running services can handle it. In our case, that means our resource request for memory should be 6GB so that we know every single pod can handle a loaded system.
Above the resource request line, we can see the resource limit line. This line should never be crossed by memory since it will result in an immediate restart of that pod. To identify the resource limit, you should monitor a pod at breaking point load. Once you know the resource consumption of your application where it can no longer run, this will be your resource limit. As seen in the graph above, our pod plateaus at 5.5GB so we can be confident that 9GB of memory will never be reached. The resource limit is a bit hard to pin down, but since the resources past the resource request aren’t guaranteed, this pod can still be scheduled and won’t hog resources from other pods. After some time the limit may become more clear, but the main purpose is to set it to something that won’t be hit unless there is a catastrophic failure.
Configuring HPA
Again using the metrics graph from above, we can see the clear increase in memory consumption as the load begins. This is the information we need to configure the HPA. The question to answer here is “At what point is it possible there’s going to be a heavy load?” - looking at our graph, that’s probably around 3.5GB of memory consumed (60% of the resource request). Now in our HPA manifest file, we will set the average utilization target to 60%. This tells the Kubernetes cluster to scale up the number of pods if we ever see 60% of the resource request being consumed.
Configuring the Node Pool
Now that everything else is in place, it’s actually just a matter of doing some math. A best practice for any system is to avoid a single point of failure, which in this case means never having less than two nodes running. That way pods are split across multiple nodes, so if either node crashes, the service remains running.
Like our pods, we want our nodes to be allocated for load. Knowing that our pod’s memory request is 6GB, and we have our HPA set to a minimum of four pods, we want one node to have 12GB of memory. We will bump this up to 14GB to account for kube-system pods that are required for the Kubernetes cluster as well as the chance that we pass the memory request. So if we have a node with 14GB of memory, and a pod is only deployed if there is 6GB of memory available, we know that each node would only have 4GB of memory available if two pods are running. This forces any new pods to be deployed onto a different node. We also know that our HPA has a maximum of 10 pods, so considering our nodes are able to handle two pods each, we want the node pool to be able to scale up to five nodes.
TL;DR
And that’s basically it! To recap some of the major points:
- Use load tests to identify your pod’s resource requirements.
- Resource requests should be set to your pod’s requirements under average load.
- Resource limits should never be reached unless there is a complete failure.
- HPA thresholds are proactive and should be set to scale up before there is a heavy load.
- There should be a minimum of two nodes. Size each node to support no more than half the minimum in your HPA manifest. This prevents a single point of failure. With proper load testing, setting the proper resource requests and limits is simple. Once request and limits are understood, configuring an HPA is straightforward. Once you have the HPA, selecting your node and node pool size is basic math. Using the tips from this post, you should now be able to optimize your Kubernetes cluster!
Architecting Kubernetes clusters — choosing a worker node size
Cluster capacity
In general, a Kubernetes cluster can be seen as abstracting a set of individual nodes as a big "super node".
The total compute capacity (in terms of CPU and memory) of this super node is the sum of all the constituent nodes' capacities.
There are multiple ways to achieve a desired target capacity of a cluster.
For example, imagine that you need a cluster with a total capacity of 8 CPU cores and 32 GB of RAM.
For example, because the set of applications that you want to run on the cluster require this amount of resources.
Here are just two of the possible ways to design your cluster:
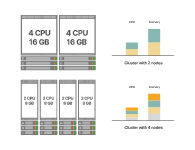 Both options result in a cluster with the same capacity — but the left option uses 4 smaller nodes, whereas the right one uses 2 larger nodes.
Which is better?
To approach this question, let's look at the pros and cons of the two opposing directions of "few large nodes" and "many small nodes".
Note that "nodes" in this article always refers to worker nodes. The choice of number and size of master nodes is an entirely different topic.
Few large nodes
The most extreme case in this direction would be to have a single worker node that provides the entire desired cluster capacity.
In the above example, this would be a single worker node with 16 CPU cores and 16 GB of RAM.
Let's look at the advantages such an approach could have.
1. Less management overhead
Simply said, having to manage a small number of machines is less laborious than having to manage a large number of machines.
Updates and patches can be applied more quickly, the machines can be kept in sync more easily.
Furthermore, the absolute number of expected failures is smaller with few machines than with many machines.
However, note that this applies primarily to bare metal servers and not to cloud instances.
If you use cloud instances (as part of a managed Kubernetes service or your own Kubernetes installation on cloud infrastructure) you outsource the management of the underlying machines to the cloud provider.
Thus managing, 10 nodes in the cloud is not much more work than managing a single node in the cloud.
2. Lower costs per node
While a more powerful machine is more expensive than a low-end machine, the price increase is not necessarily linear.
In other words, a single machine with 10 CPU cores and 10 GB of RAM might be cheaper than 10 machines with 1 CPU core and 1 GB of RAM.
However, note that this likely doesn't apply if you use cloud instances.
In the current pricing schemes of the major cloud providers Amazon Web Services, Google Cloud Platform, and Microsoft Azure, the instance prices increase linearly with the capacity.
For example, on Google Cloud Platform, 64 n1-standard-1 instances cost you exactly the same as a single n1-standard-64 instance — and both options provide you 64 CPU cores and 240 GB of memory.
So, in the cloud, you typically can't save any money by using larger machines.
3. Allows running resource-hungry applications
Having large nodes might be simply a requirement for the type of application that you want to run in the cluster.
For example, if you have a machine learning application that requires 8 GB of memory, you can't run it on a cluster that has only nodes with 1 GB of memory.
But you can run it on a cluster that has nodes with 10 GB of memory.
Having seen the pros, let's see what the cons are.
1. Large number of pods per node
Running the same workload on fewer nodes naturally means that more pods run on each node.
This could become an issue.
The reason is that each pod introduces some overhead on the Kubernetes agents that run on the node — such as the container runtime (e.g. Docker), the kubelet, and cAdvisor.
For example, the kubelet executes regular liveness and readiness probes against each container on the node — more containers means more work for the kubelet in each iteration.
The cAdvisor collects resource usage statistics of all containers on the node, and the kubelet regularly queries this information and exposes it on its API — again, this means more work for both the cAdvisor and the kubelet in each iteration.
If the number of pods becomes large, these things might start to slow down the system and even make it unreliable.
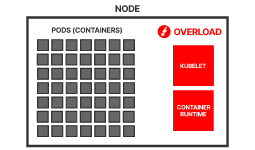 There are reports of nodes being reported as non-ready because the regular kubelet health checks took too long for iterating through all the containers on the node.
For these reasons, Kubernetes recommends a maximum number of 110 pods per node.
Up to this number, Kubernetes has been tested to work reliably on common node types.
Depending on the performance of the node, you might be able to successfully run more pods per node — but it's hard to predict whether things will run smoothly or you will run into issues.
Most managed Kubernetes services even impose hard limits on the number of pods per node:
- On Amazon Elastic Kubernetes Service (EKS), the maximum number of pods per node depends on the node type and ranges from 4 to 737.
- On Google Kubernetes Engine (GKE), the limit is 100 pods per node, regardless of the type of node.
- On Azure Kubernetes Service (AKS), the default limit is 30 pods per node but it can be increased up to 250. So, if you plan to run a large number of pods per node, you should probably test beforehand if things work as expected.
2. Limited replication
A small number of nodes may limit the effective degree of replication for your applications.
For example, if you have a high-availability application consisting of 5 replicas, but you have only 2 nodes, then the effective degree of replication of the app is reduced to 2.
This is because the 5 replicas can be distributed only across 2 nodes, and if one of them fails, it may take down multiple replicas at once.
On the other hand, if you have at least 5 nodes, each replica can run on a separate node, and a failure of a single node takes down at most one replica.
Thus, if you have high-availability requirements, you might require a certain minimum number of nodes in your cluster.
3. Higher blast radius
If you have only a few nodes, then the impact of a failing node is bigger than if you have many nodes.
For example, if you have only two nodes, and one of them fails, then about half of your pods disappear.
Kubernetes can reschedule workloads of failed nodes to other nodes.
However, if you have only a few nodes, the risk is higher that there is not enough spare capacity on the remaining node to accommodate all the workloads of the failed node.
The effect is that parts of your applications will be permanently down until you bring up the failed node again.
So, if you want to reduce the impact of hardware failures, you might want to choose a larger number of nodes.
4. Large scaling increments
Kubernetes provides a Cluster Autoscaler for cloud infrastructure that allows to automatically add or remove nodes based on the current demand.
If you use large nodes, then you have a large scaling increment, which makes scaling more clunky.
For example, if you only have 2 nodes, then adding an additional node means increasing the capacity of the cluster by 50%.
This might be much more than you actually need, which means that you pay for unused resources.
So, if you plan to use cluster autoscaling, then smaller nodes allow a more fluid and cost-efficient scaling behaviour.
Having discussed the pros and cons of few large nodes, let's turn to the scenario of many small nodes.
Many small nodes
This approach consists of forming your cluster out of many small nodes instead of few large nodes.
What are the pros and cons of this approach?
The pros of using many small nodes correspond mainly to the cons of using few large nodes.
1. Reduced blast radius
If you have more nodes, you naturally have fewer pods on each node.
For example, if you have 100 pods and 10 nodes, then each node contains on average only 10 pods.
Thus, if one of the nodes fails, the impact is limited to a smaller proportion of your total workload.
Chances are that only some of your apps are affected, and potentially only a small number of replicas so that the apps as a whole stay up.
Furthermore, there are most likely enough spare resources on the remaining nodes to accommodate the workload of the failed node, so that Kubernetes can reschedule all the pods, and your apps return to a fully functional state relatively quickly.
2. Allows high replication
If you have replicated high-availability apps, and enough available nodes, the Kubernetes scheduler can assign each replica to a different node.
You can influence scheduler's the placement of pods with node affinites, pod affinities/anti-affinities, and taints and tolerations.
This means that if a node fails, there is at most one replica affected and your app stays available.
Having seen the pros of using many small nodes, what are the cons?
1. Large number of nodes
If you use smaller nodes, you naturally need more of them to achieve a given cluster capacity.
But large numbers of nodes can be a challenge for the Kubernetes control plane.
For example, every node needs to be able to communicate with every other node, which makes the number of possible communication paths grow by square of the number of nodes — all of which has to be managed by the control plane.
The node controller in the Kubernetes controller manager regularly iterates through all the nodes in the cluster to run health checks — more nodes mean thus more load for the node controller.
More nodes mean also more load on the etcd database — each kubelet and kube-proxy results in a watcher client of etcd (through the API server) that etcd must broadcast object updates to.
In general, each worker node imposes some overhead on the system components on the master nodes.
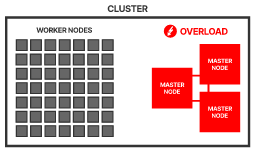 Officially, Kubernetes claims to support clusters with up to 5000 nodes.
However, in practice, 500 nodes may already pose non-trivial challenges.
The effects of large numbers of worker nodes can be alleviated by using more performant master nodes.
That's what's done in practice — here are the master node sizes used by kube-up on cloud infrastructure:
- Google Cloud Platform
- 5 worker nodes → n1-standard-1 master nodes
- 500 worker nodes → n1-standard-32 master nodes
- Amazon Web Services
- 5 worker nodes → m3.medium master nodes
- 500 worker nodes → c4.8xlarge master nodes As you can see, for 500 worker nodes, the used master nodes have 32 and 36 CPU cores and 120 GB and 60 GB of memory, respectively.
These are pretty large machines!
So, if you intend to use a large number of small nodes, there are two things you need to keep in mind:
-
The more worker nodes you have, the more performant master nodes you need
-
If you plan to use more than 500 nodes, you can expect to hit some performance bottlenecks that require some effort to solve
New developments like the Virtual Kubelet allow to bypass these limitations and allow for clusters with huge numbers of worker nodes.
2. More system overhead
Kubernetes runs a set of system daemons on every worker node — these include the container runtime (e.g. Docker), kube-proxy, and the kubelet including cAdvisor.
cAdvisor is incorporated in the kubelet binary.
All of these daemons together consume a fixed amount of resources.
If you use many small nodes, then the portion of resources used by these system components is bigger.
For example, imagine that all system daemons of a single node together use 0.1 CPU cores and 0.1 GB of memory.
If you have a single node of 10 CPU cores and 10 GB of memory, then the daemons consume 1% of your cluster's capacity.
On the other hand, if you have 10 nodes of 1 CPU core and 1 GB of memory, then the daemons consume 10% of your cluster's capacity.
Thus, in the second case, 10% of your bill is for running the system, whereas in the first case, it's only 1%.
So, if you want to maximise the return on your infrastructure spendings, then you might prefer fewer nodes.
3. Lower resource utilisation
If you use smaller nodes, then you might end up with a larger number of resource fragments that are too small to be assigned to any workload and thus remain unused.
For example, assume that all your pods require 0.75 GB of memory.
If you have 10 nodes with 1 GB memory, then you can run 10 of these pods — and you end up with a chunk of 0.25 GB memory on each node that you can't use anymore.
That means, 25% of the total memory of your cluster is wasted.
On the other hand, if you use a single node with 10 GB of memory, then you can run 13 of these pods — and you end up only with a single chunk of 0.25 GB that you can't use.
In this case, you waste only 2.5% of your memory.
So, if you want to minimise resource waste, using larger nodes might provide better results.
4. Pod limits on small nodes
On some cloud infrastructure, the maximum number of pods allowed on small nodes is more restricted than you might expect.
This is the case on Amazon Elastic Kubernetes Service (EKS) where the maximum number of pods per node depends on the instance type.
For example, for a t2.medium instance, the maximum number of pods is 17, for t2.small it's 11, and for t2.micro it's 4.
These are very small numbers!
Any pods that exceed these limits, fail to be scheduled by the Kubernetes scheduler and remain in the Pending state indefinitely.
If you are not aware of these limits, this can lead to hard-to-find bugs.
Thus, if you plan to use small nodes on Amazon EKS, check the corresponding pods-per-node limits and count twice whether the nodes can accommodate all your pods.
Conclusion
So, should you use few large nodes or many small nodes in your cluster?
As always, there is no definite answer.
The type of applications that you want to deploy to the cluster may guide your decision.
For example, if your application requires 10 GB of memory, you probably shouldn't use small nodes — the nodes in your cluster should have at least 10 GB of memory.
Or if your application requires 10-fold replication for high-availability, then you probably shouldn't use just 2 nodes — your cluster should have at least 10 nodes.
For all the scenarios in-between it depends on your specific requirements.
Which of the above pros and cons are relevant for you? Which are not?
That being said, there is no rule that all your nodes must have the same size.
Nothing stops you from using a mix of different node sizes in your cluster.
The worker nodes of a Kubernetes cluster can be totally heterogeneous.
This might allow you to trade off the pros and cons of both approaches.
In the end, the proof of the pudding is in the eating — the best way to go is to experiment and find the combination that works best for you!
2 способа направить трафик Ingress между пространствами Kubernetes
The tech industry of full of workarounds, you are probably using or relying on some workaround. And there is no problem with that per se. But most important is that when you do a workaround you should be aware of that and change it to the standard way if it's more intuitive.
Проблема
A couple of years ago I had a use case where a single domain had 2 sub-paths each of them having its own service in different namespaces. Let's see this example:
Пару лет назад я встретил такую ситуацию когда один домен имел 2 дополнительных маршрута к сервисам которые находились в соседних namespaces. Давайте рассмотрим пример:
example.com/app => сервис "backend" в пространстве "app"
example.com/blog => сервис "wordpress" в пространстве "blog".
Проблема была в том, что Ingress может отправлять траффик в сервис внутри одного пространства, ingress может быть только 1 для домен. Но дальше Nginx Ingress ввели так называемый Mergeable Ingress Resources. Однако, в это же время я работал со старой версией которая не поддерживала подобного.
В след раз, я нашел общее решение которое выглядит как костыли. В общем говоря, это не плохие костыли. В зависимости о том, как вы управляете инфраструктурой, и вы можете смотреть на это как централизованное или нецентрализованное применение .
Возможно два решения.
The Solution So here are the 2 ways to route Ingress traffic across namespaces in Kubernetes. The 1st one you could call the standard way (which relies on the Ingress controller capabilities), and 2nd is the generic way that I used back in the days.
1. Mergeable Ingress Resources
If you took a look at the official Nginx docs you will find the Cross-namespace Configuration page suggests using Mergeable Ingress Resources. That approach relies on a simple idea, there is a single Ingress resource that has all configurations related to the host/domain and that resource is called "master", and any number of the Ingress resources handles the paths under that host/domain and each of these resources is called "minion".
Each one of the master or minion can or can not contain some of the Ingress annotations based on their role. Here I will use here the examples from the official documentation. 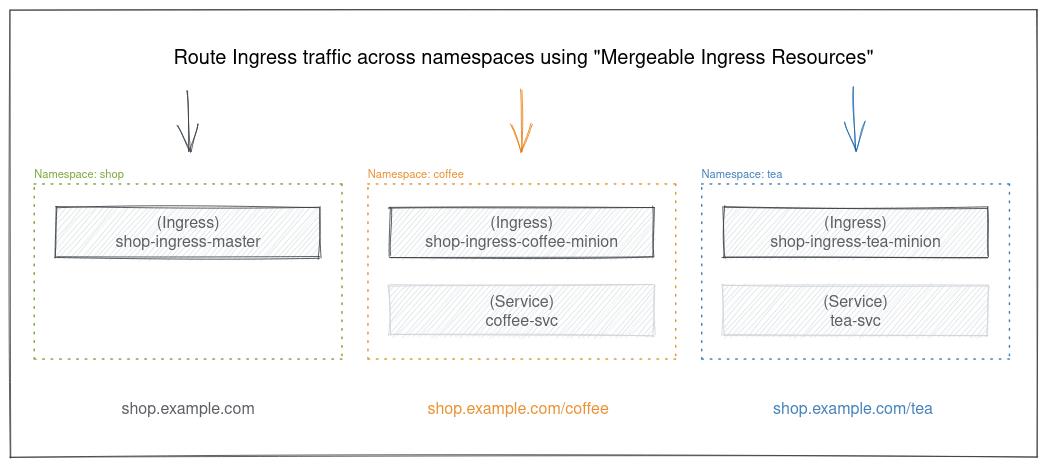
Config for shop.example.com like TLS and host-level annotations.
apiVersion: networking.k8s.io/v1
kind: Ingress
metadata:
  name: shop-ingress-master
  namespace: shop
  annotations:
    kubernetes.io/ingress.class: "nginx"
    nginx.org/mergeable-ingress-type: "master"
spec:
  tls:
  - hosts:
    - shop.example.com
    secretName: shop-secret
  rules:
  - host: shop.example.com
Config for shop.example.com/coffee which is in the coffee namespace and routes the traffic of the coffee-svc service.
apiVersion: networking.k8s.io/v1
kind: Ingress
metadata:
  name: shop-ingress-coffee-minion
  namespace: coffee
  annotations:
    kubernetes.io/ingress.class: "nginx"
    nginx.org/mergeable-ingress-type: "minion"
spec:
  rules:
  - host: shop.example.com
    http:
      paths:
      - path: /coffee
        pathType: Prefix
        backend:
          service:
            name: coffee-svc
            port:
              number: 80
Config for shop.example.com/tea which is in the tea namespace and routes the traffic of the tea-svc service.
apiVersion: networking.k8s.io/v1
kind: Ingress
metadata:
  name: shop-ingress-tea-minion
  namespace: tea
  annotations:
    kubernetes.io/ingress.class: "nginx"
    nginx.org/mergeable-ingress-type: "minion"
spec:
  rules:
  - host: shop.example.com
    http:
      paths:
      - path: /tea
        pathType: Prefix
        backend:
          service:
            name: tea-svc
            port:
              number: 80
As you see, the Ingress config is split into 2 parts, the host/domain config, and the paths config. Each one of them could be in a different namespace and handles the services in that namespace.
2. ExternalName Service
For one reason or another, that non-centralized way of managing Ingress resources (where the Ingress object is split across namespaces) might not fit all workloads. So here is another way I used it before and I find it much simpler for many use cases.
This method relies on native Kubernetes ExternalName Service which is simply a DNS CNAME! This method is centralized where it uses the normal Ingress object in addition to ExternalName Service within the same namespace as a bridge to the services in any other namespace.
The following is an example of that setup with a single Ingress resource and 2 ExternalName services. 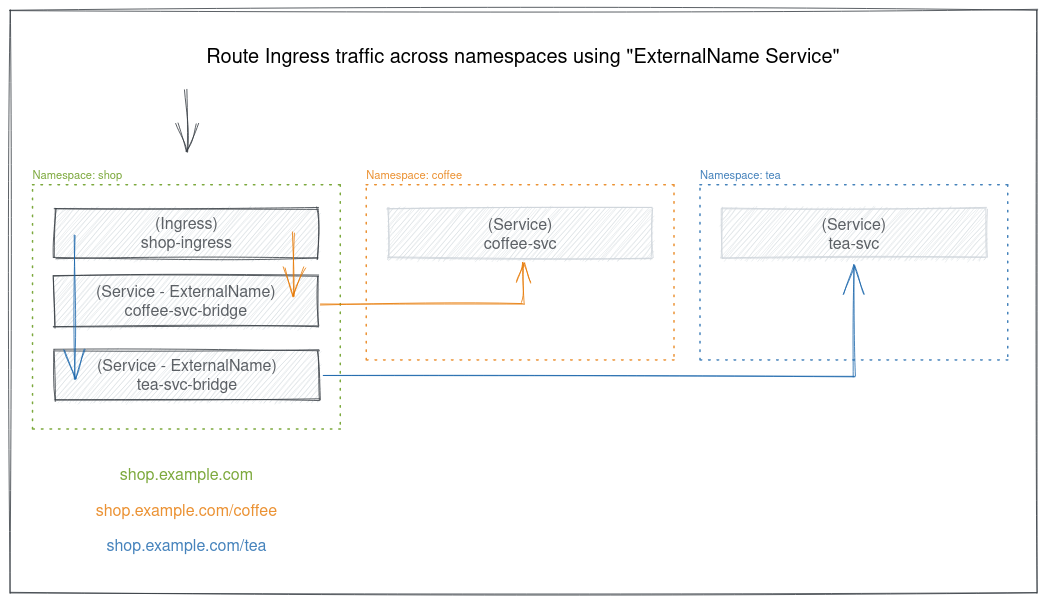
Config for shop.example.com including the 2 sub-paths /coffee and /tea.
apiVersion: networking.k8s.io/v1
kind: Ingress
metadata:
  name: shop-ingress
  namespace: shop
  annotations:
    kubernetes.io/ingress.class: "nginx"
spec:
  tls:
  - hosts:
    - shop.example.com
    secretName: shop-secret
  rules:
  - host: shop.example.com
    http:
      paths:
      - path: /coffee
        pathType: Prefix
        backend:
          service:
            name: coffee-svc-bridge
            port:
              number: 80
      - path: /tea
        pathType: Prefix
        backend:
          service:
            name: tea-svc-bridge
            port:
              number: 80
The coffee-svc-bridge service in the shop namespace is a CNAME for the coffee-svc service in coffee namespace:
apiVersion: v1
kind: Service
metadata:
  name: coffee-svc-bridge
  namespace: shop
spec:
  type: ExternalName
  externalName: coffee-svc.coffee
The tea-svc-bridge service in the shop namespace is a CNAME for the tea-svc service in tea namespace:
apiVersion: v1
kind: Service
metadata:
  name: tea-svc-bridge
  namespace: shop
spec:
  type: ExternalName
  externalName: tea-svc.tea
As you see, the Ingress config comes in 1 part and is normal. And use the ExternalName services as a bridge to access the services in the other namespaces.
Conclusion
Maybe the second approach looks like a workaround, but for some workloads could be better and easier to follow and digest. But in general, it's good to have different ways to use what's fit better.
Enjoy :-)
Сетевое взаимодействие между подами
Через nginx контейнер рядом с основновым.
Рядом с основным контейнером запускаем nginx со следующим примером конфига
~~~~
     location = /example_api/testapi {
        proxy_set_header        X-Forwarded-HTTPS $scheme;
~~~~~
        proxy_set_header        X-Scheme $scheme;
        proxy_http_version      1.1;
        proxy_set_header        X-NginX-Proxy true;
        proxy_set_header        Upgrade $http_upgrade;
        proxy_set_header        Connection $http_connection;
~~~~~
        resolver kube-dns.kube-system ipv6=off valid=10s;
        resolver_timeout 5s;
        set $backend "http://test-api-service-name.test-api-namespace-name.svc.cluster.local/example_api/testapi$is_args$args";
        proxy_pass $backend;
      }
~~~~~~